Java Performance
Most of the applications today are designed and developed for simultaneous use by a large number of users. At times there are underlying problems in the code, which may cause error conditions such as Memory leaks, Race conditions, Thread locks and so on which if neglected, stretches the use of resources beyond limits, causing the application to slow down or even crash. Profiling can help you detect these problems and help you optimize your Java applications. We will try to understand few important aspects with Java Profiling. Following document will help you understand what Java Profiling means, why Java Profiling is required and how you can successfully implement Java Profiling for your Java applications using AppPerfect.
What is Java Profiling?
Java Profiling is the process of monitoring various JVM level parameters such as Method Execution, Thread Execution, Object Creation and Garbage Collection. Java Profiling provides you with a finer view of your target application execution and its resource utilization. Java Profiling eliminates the need to spend long hours going through the code, and pinpoints the problems associated with your application. Java Profiling provides complete and accurate statistical information that helps you trace coding errors in your application. Java Profiling helps you diagnose and resolve performance problems, memory leaks and multi-threading problems in your Java or J2EE server applications to ensure the highest level of stability and scalability for your applications. Java Profiling provides you with a root-cause analysis of these problems and helps you resolve them.
Early detection and resolution of bottlenecks and performance related issues is a critical step towards improving the stability, efficiency and overall performance of an application. Java Profiling should be performed early and at regular intervals in the software development life-cycle. Java Profiling must be performed before the code is finally executed and deployed to identify critical issues that affect the stability and quality of the software.
Java Profiling may thus be summarized as measuring statistics of a Java application, specifically in terms of:
- CPU time being utilized per method
- Memory being utilized
- Method call information
- Objects being created
- Objects being garbage collected
Java Profiling with AppPerfect
AppPerfect offers Java Profiling solution in form of AppPerfect Java Profiler. Faster, efficient and more powerful machines temporarily hide performance and other problems, but errors in code if left unidentified can cause major application as well as system performance issues. To detect such coding faults manually is an extremely tedious, error prone and expensive task. The AppPerfect Java Profiler is designed to assist you find such errors by profiling your application as well as vital resources of the system on which you are running the application.
AppPerfect Java Profiler is found to be most affordable, cost effective, efficient, reliable and accurate solution by its customers. We will now try to understand how you can successfully implement Java Profiling for your Java application using AppPerfect Java Profiler.
Setting up your Java Application for Profiling :
The first step in Profiling your Java application is to setup a New Java Profiler Project. Follow the steps below to create a new project.
- Start AppPerfect Java Profiler product and select File -> New.. menu option to create a New Java Profiling project. For details on New Project creation refer to Creating a New Project chapter. For details on configuring project properties refer to Setting Project Properties chapter.
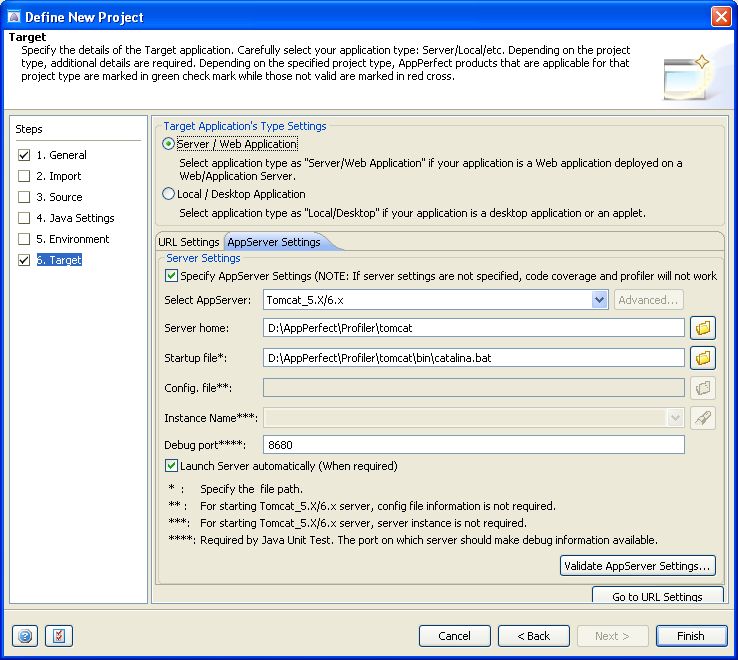
- Provide the Name of the project and select the "Target" tab to configure your target application for profiling. You can either profile Server/Web application or can choose to profile Load/Desktop application. In this tab you need to configure the Run Configuration for target application. Server applications are typically applications that are deployed in a J2EE application server such as BEA WebLogic, IBM WebSphere, JBoss, Apache Tomcat, Oracle Server, SunOne etc. Local/desktop applications typically run on your local machine as a single user system. For details refer to Configuring Target Application Settings chapter.
- Once you are done setting up project, select Project -> Run menu option to start profiling Java application. For details refer to Profiling an Application chapter.
Comprehensive Heap Analysis capability:
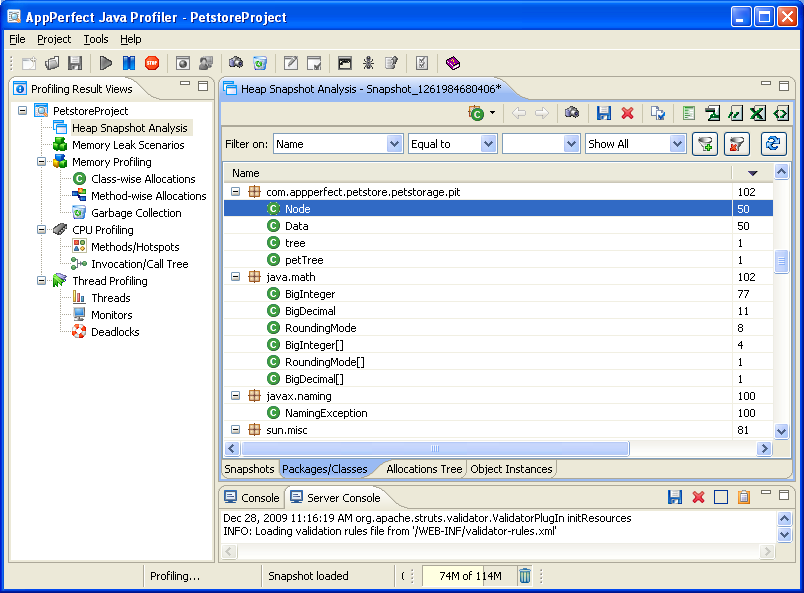
AppPerfect's Java Profiling tool provides support for capturing complete Heap Snapshot. The JVM is capable of providing a snapshot of the entire JVM memory. This memory dump is assured to be the exact state of the JVM memory at the time the snapshot was taken. Such a heap snapshot can provide invaluable data in understanding how memory is allocated and used. Specifically, the Heap snapshot provides a summary of the classes, instances, allocations, out-references and in-references of the objects that are held in the heap at a particular time.
To take Heap Snapshot select the Project -> Take Snapshot... menu option. After the snapshot is taken, a list of classes/objects present in the heap at the time of taking the snapshot can be seen, the details of any class/object can be viewed by double clicking it. For details on Heap Snapshot refer to Heap Browser chapter.
Tracking Allocations and Garbage Collection:
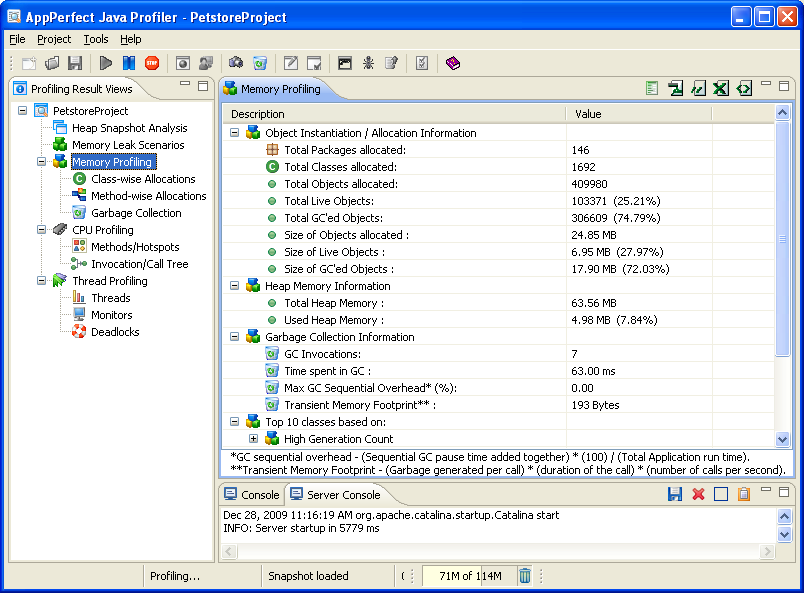
Effective memory management ensures optimized performance from any application. Memory Profiling provides information about the memory used by your application. It shows the allocations, the stack trace for the allocations, the size of the objects and the status of the objects. This information is presented in the form of charts and tables for easy interpretation and clearly shows the high memory consumption areas of the application. You can also view the details on Garbage collection, the objects which are garbage collected and the time consumed during garbage collection. All the views are updated in real-time providing the profiling data immediately as your application is running.
The Memory Profiling views can be accessed from the Navigation Tree by selecting the Memory Profiling node. For details refer to Memory Profiling chapter.
Detecting possible Memory Leaks:
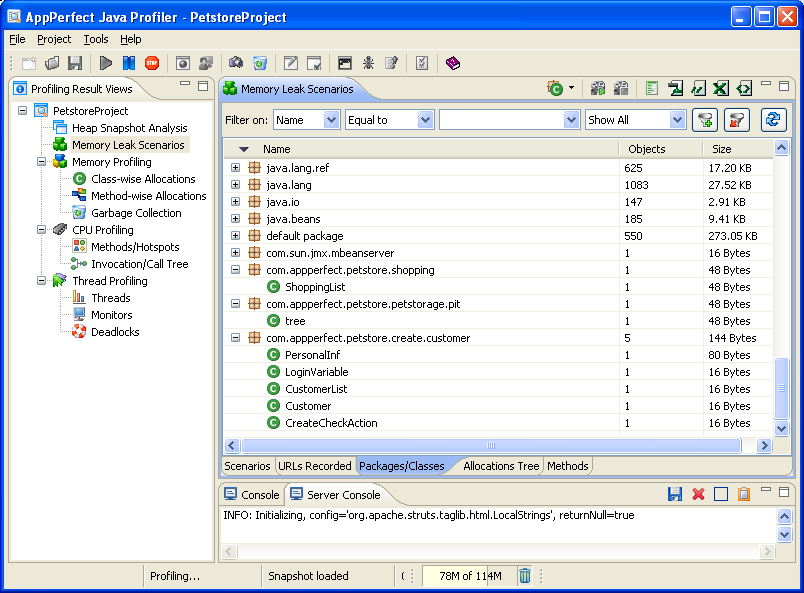
Memory Leaks can be defined as an application error whereby memory is allocated but never freed and all references to this memory are lost by the system. Memory Leaks can lead to unchecked memory growth which will slow down your application and eventually crash it. Memory Leak Scenarios feature is designed to help detect possible memory leaks in your application. To start the scenario click on Start Scenario toggle button. AppPerfect Java Profiler will force a Garbage Collection and register all live objects present in memory after the GC. Perform actions in your application based on your usage scenario. Once you have finished executing the scenario, click on the Stop Scenario toggle button. AppPerfect Java Profiler will again force a Garbage Collection and will register all live objects in memory after the GC. It will then find out differences in the live objects between start and end of scenario. Objects that are created during the scenario run but not disposed by Garbage Collection are shown in the Scenario details tab. To further investigate and trace these objects, take a Heap Snapshot and concentrate on only those classes for which the leaked objects are reported.
The Memory Leak Scenarios view can be accessed from the Navigation Tree by selecting the Memory Leak Scenarios node. For details refer to Java Memory Leak Profiling chapter.
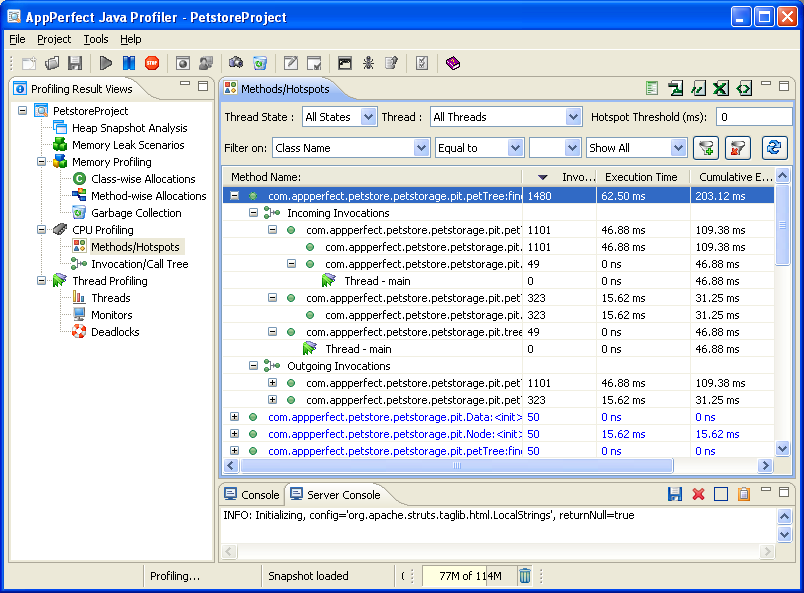
Finding Performance Bottleneck:
CPU profiling provides a close look into the interaction of the JVM with the CPU. Understanding how your CPU cycles were consumed can help you identify performance bottlenecks. With AppPerfect Java Profiler, you can view in detail the methods and their relative time and resource consumption with reference to the CPU. CPU profiling provides you with complete method details including Method Name, Class Name, Signature, Invocation Count, Self Time and Total Time of methods that have been executed. So in a glance, you can see the number of times a method was invoked and the time it took to execute itself as well as the time it took to execute overall, including execution of any procedures, or method calls
The CPU Profiling views can be accessed from the Navigation Tree by selecting the CPU Profiling node. For details refer to Java Performance Profiling chapter.
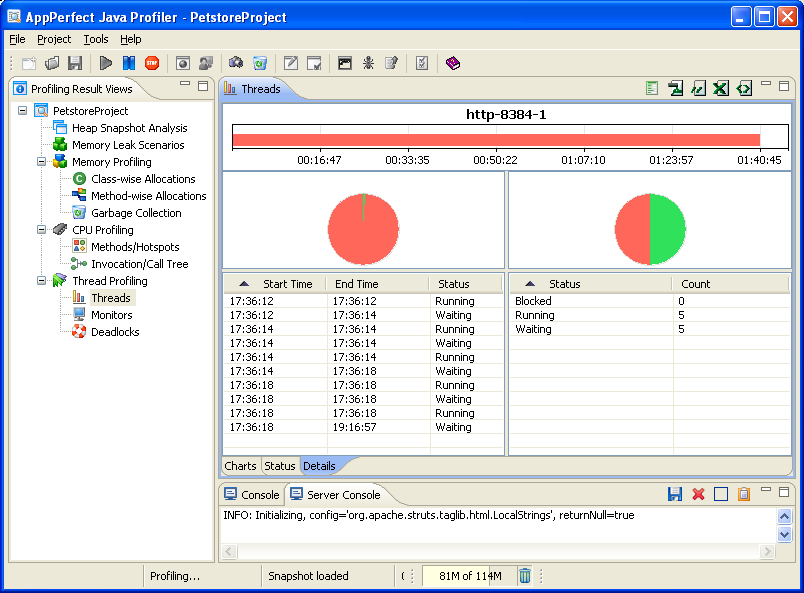
Tracing problems related to Threading:
Use of multiple threads is essential to building scalable and reliable applications. Working with multiple threads brings up other issues such as concurrency and contention over resources. Thread analysis provides information about the threads that are created and used by the application being profiled. The different analytical reports show the state of the threads and monitors which help you to detect race conditions, contentions and deadlocks if any in your application.
The Thread Profiling views can be accessed from the Navigation Tree by selecting the Thread Profiling node. For details refer to Java Thread Profiling chapter.
On-Demand Profiling :
Profiling a JVM requires the Profiler to connect to and collect all relevant information from the running application. This is generally done during development stage. This type of profiling is 'Development mode' profiling. However, it has been observed that often an application profiled during development does not throw up issues, but after deployment, it does. In such cases it becomes necessary to profile the production JVM directly. Therefore to address the needs for profiling an application that is already in production, AppPerfect Java Profiler provides "On-demand" profiling.
On Demand or Production mode profiling allows you to profile your deployed application. This is different from Development mode profiling, where you profile your under-development application. On-demand profiling can be defined as profiling of the JVM of a deployed application as and when required without the need to start and stop the JVM along with the profiling. This reduces your system overheads to a great deal as you can start the application to be profiled once and then connect to it for profiling 'on-demand' without having to stop it when you wish to stop profiling or re-start to profile again. To change profiling type to On-Demand mode, select Project -> Properties.. menu option and under Profiling Type tab change the option to On-Demand profiling.
Development mode Profiling collects more information about the target JVM being profiled as all the methods are always under the Java Profiler's purview. However, in On-demand profiling, the Java Profiler collects information only from the methods that have been launched and are active during profiling session.
Option to Profile Applications Remotely :
AppPerfect Java Profiler supports profiling applications remotely. All it requires is to have AppPerfect Java Profiler installed on the remote machine. AppPerfect uses its remote service to fetch the profiling data from remote server. To configure Java Profiler for remote profiling select the Project -> Preferences.. menu option and in General tab provide the Target Machine settings where the application to be profiled will be running. For details refer to Profiling a Remote Java Application chapter.
Support for Multiple platforms and Application Servers:
AppPerfect Java Profiler integrates smoothly into your environment: We provide support for profiling on a wide range of platforms including Microsoft Windows 2000/XP/2003/Windows 7, Linux x86, Solaris, MAC OSX and AIX, both for 32-bit and 64-bit JVMs. AppPerfect supports integration with most of the application servers ensuring that you can get started with profiling instantly. Integration is currently supported for Tomcat, WebLogic, WebSphere, WSAD, RAD, JBoss, JRun, J2EE, Resin, Oracle, Jetty, Orion, SunOne application servers. For others not in this list, you can follow the instructions for profiling and configure required application server for profiling. In general AppPerfect can profile any Java based Application/Server.
Java Profiling with Team Sharing Support:
Test Engineers can share the profiling results with different members in the team. Profiling results can be shared with developers which they can use to track the performance and memory related issues in application. AppPerfect supports integration with Subversion (SVN) version control system. For details on integration with Subversion server refer to Team Server Configuration chapter.
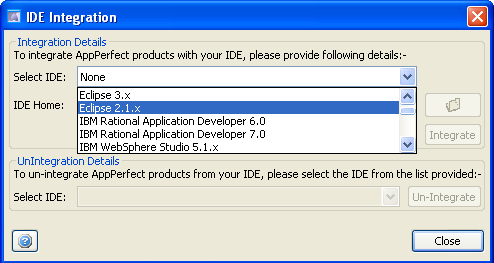
IDE Integration Support:
IDE Integration is a highly useful feature in AppPerfect products. Once product is integrated in IDE you can start IDE and can execute Java Profiling for your Java / J2EE Projects from within IDE. You can integrate AppPerfect applications with Eclipse, IBM Rational Application Developer (RAD), NetBeans, IntelliJ Idea, JBuilder, Oracle JDeveloper and BEA Workshop studio.
Select Tools -> IDE Integration menu option to integrate with any of the supported IDEs. For details on integration with IDE refer to IDE Integration chapter.
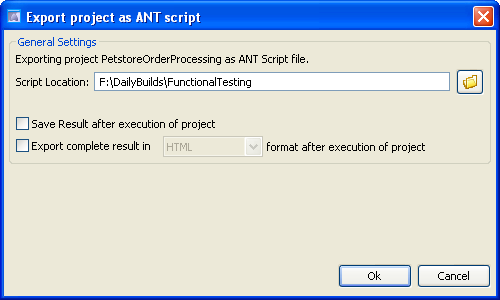
Integrate Java Profiling with your Daily Build Process with ANT Script and Command line Support:
AppPerfect supports integration with build process smoothly. You just need to export Java Profiling project as ANT Script or Command Line script and then you can execute these exported scripts from your build process. This way you can ensure that each build is profiled before final deployment. To Export project as Ant Script select Tools -> Export Project as ANT Script... menu option. For details on ANT script execution refer to ANT Script Execution chapter.
Conclusion :
AppPerfect Java Profiler helps you diagnose and resolve performance problems, memory leaks and multi-threading problems in your Java or J2EE server applications to ensure the highest level of stability and scalability for your applications. AppPerfect Java Profiler provides you with a root-cause analysis of these problems and helps you resolve them.
AppPerfect Java Profiler provides you a unified view of all resources that is memory, methods, threads and monitors to help you understand your JVM's behavior, performance characteristics etc. to reach to bottom of problem quickly. AppPerfect Java Profiler is a comprehensive Java performance tuning solution with support for Heap Analysis, Thread Analysis, Monitor analysis and Deadlocks detection. It is one of the best and finest profiler available in the large market of profilers.AppPerfect Java Profiler is found to be most affordable, cost effective, efficient, reliable and accurate profiling solution by its customers. In case you have not yet tried AppPerfect Java Profiler, Download Now and give it a try today.