Database Query Monitor
Database Query Monitor helps you to monitor the number of rows retrieved as the output of query execution on the database. Database Query Monitor provide extensive information so that necessary steps can be taken before a breakdown of vital business processes occurs. for example, If the row count is greater than 0 in an error table, you will get notified for some failure in database functionality.
MySQL Monitoring with AppPerfect
AppPerfect offers Database Query Monitor in the form of AppPerfect Agentless Monitor. AppPerfect's Database Monitoring is the ideal solution to monitor your Database Queries. AppPerfect's Database Query Monitoring is found to be most efficient, reliable and accurate solution by its customers.
Following steps will explain how you can configure AppPerfect for Monitoring your Database Queries:
- Once you are logged into the Monitor Server you can see the Web-UI from which you can access all the features of the Monitor Server. Click the Monitors link from the top navigation bar. This will take you to Monitors tab. Click on Add button to Add a New Database Query Monitor.
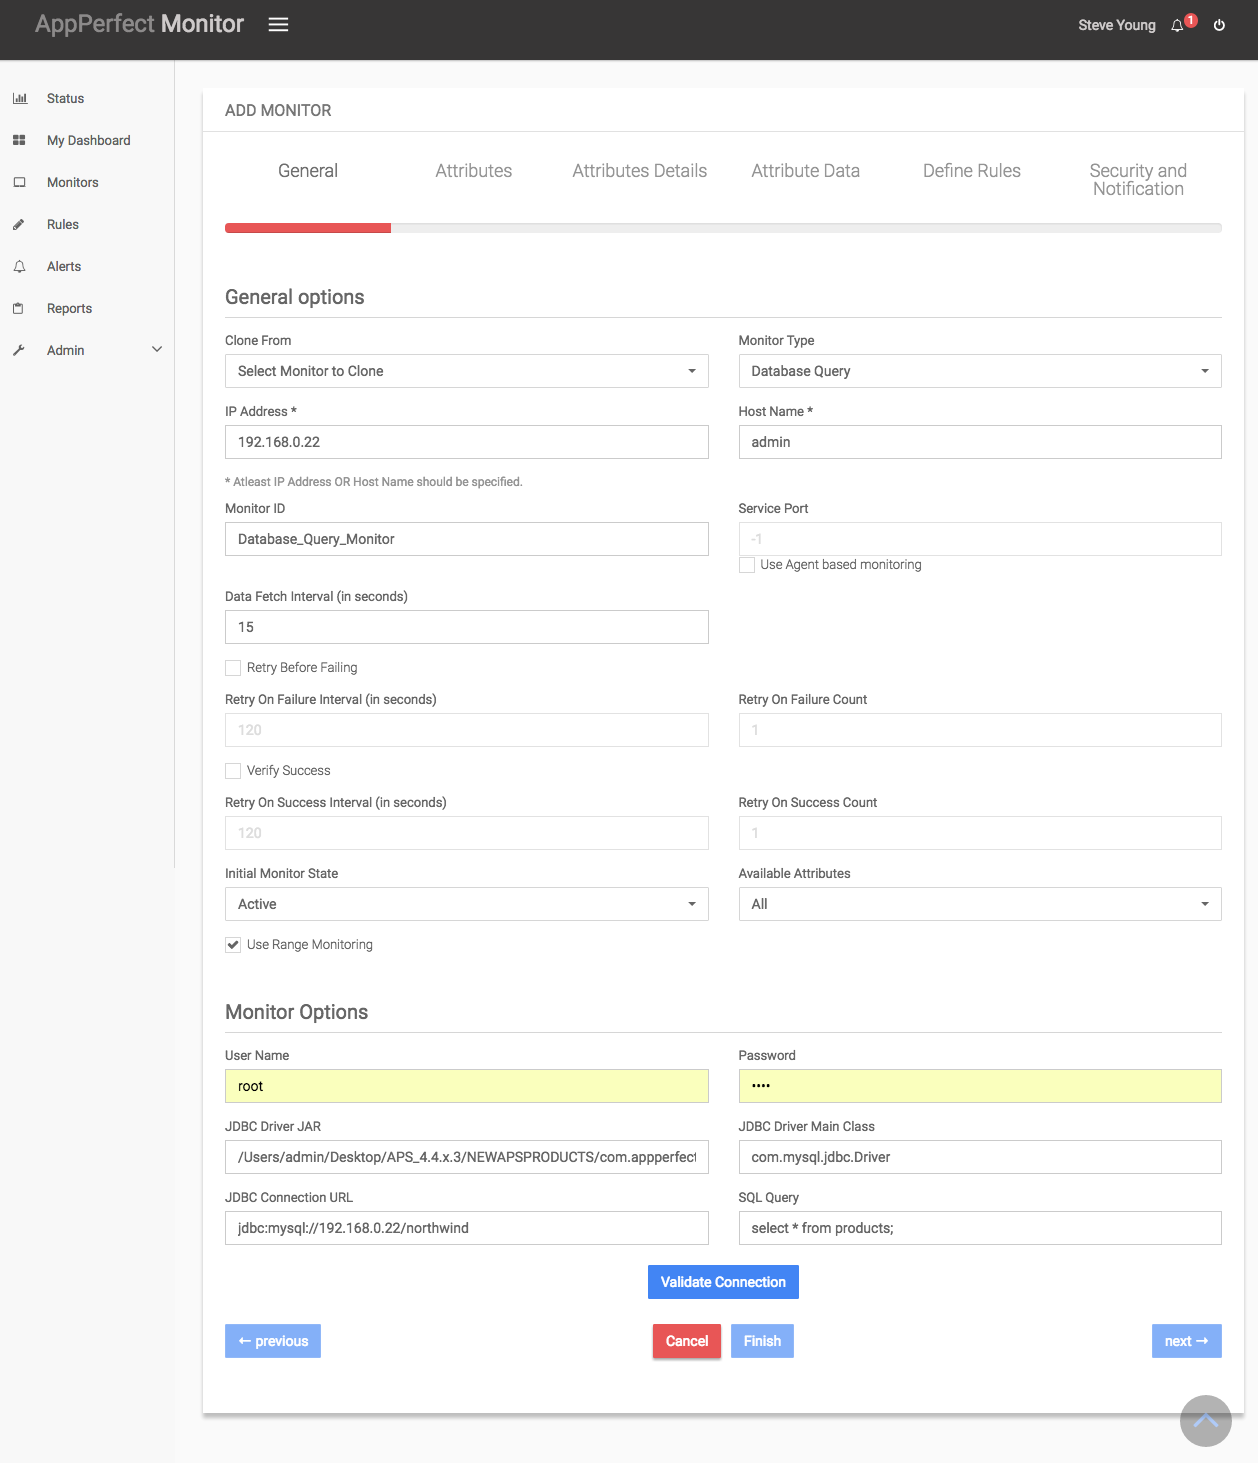
- Next Step is to define the Database Query Monitor. Provide the IP Address or Host Name of the target database server for which the query results need to be monitored.
- Select the Database Query Monitor Type from the drop down. AppPerfect can monitor the queries on Oracle 8.x/9.x/10.x, MS SQL Server, MySQL, DB2 and Sybase databases for performance and robustness. Select the monitor type which suits your requirement. For database specific configuration for monitoring refer to Database Monitor chapter.
- Specify a meaningful identifier for the monitor which will help identify the monitor in future.
- Specify the Data Fetch Interval which represents the time interval for which application should wait before fetching the monitoring data from the device. Monitoring Data will be fetched after every specified fetch interval. The smaller the time interval, the more granular the data. However, smaller time intervals also result in a much larger data set.
- You can specify if the monitor should be Active as soon as its added or should it be in suspended state.
- Next Option is to provide database specific configuration settings. AppPerfect uses JDBC protocol to connect to the target database and fetch the required monitoring information. Provide the user credentials, JDBC driver jar, JDBC driver class and connection URL for accessing database. Provide the query for which you want to monitor the results. This Query can be simple 'SELECT *' query or a complex query consisting of joins and conditions. Once you are done providing the database settings, click on Validate Connection button to confirm that the target database is accessible.
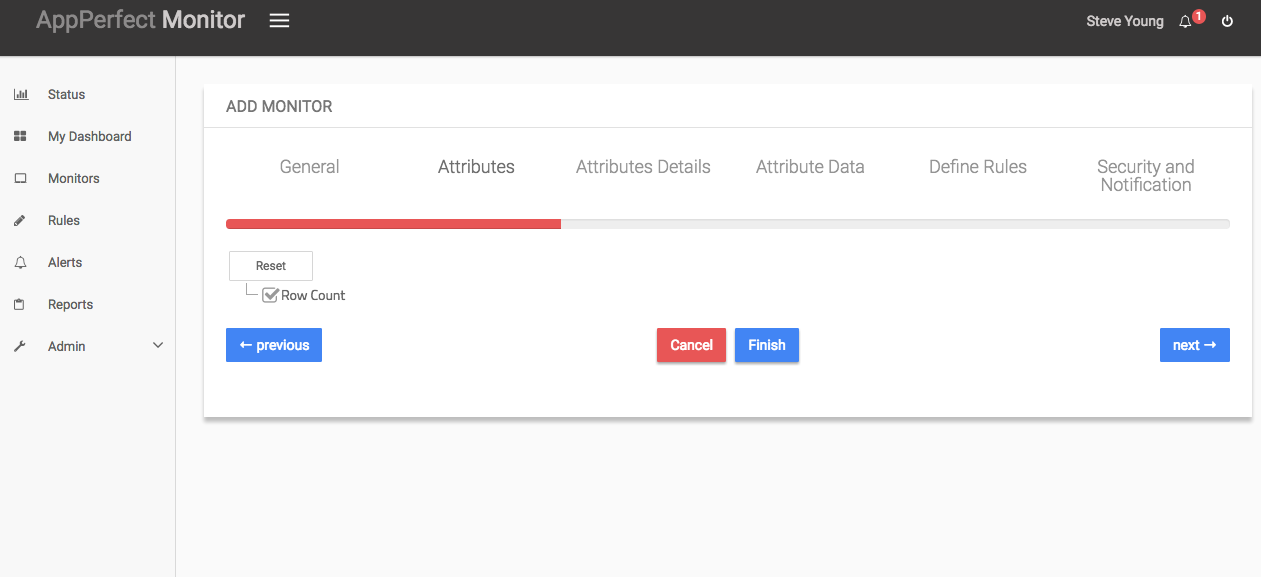
- Next Step is to Select the Attributes to monitor. Database Monitoring allows you to monitor crucial parameters such as Key Read/Write requests, Table locks, Threads information, Memory consumption, Connections information, Transaction Rate, User Call Rate etc. Select the parameters you need to monitor from the list of attributes shown. For details on supported attributes refer to Database Monitor chapter.
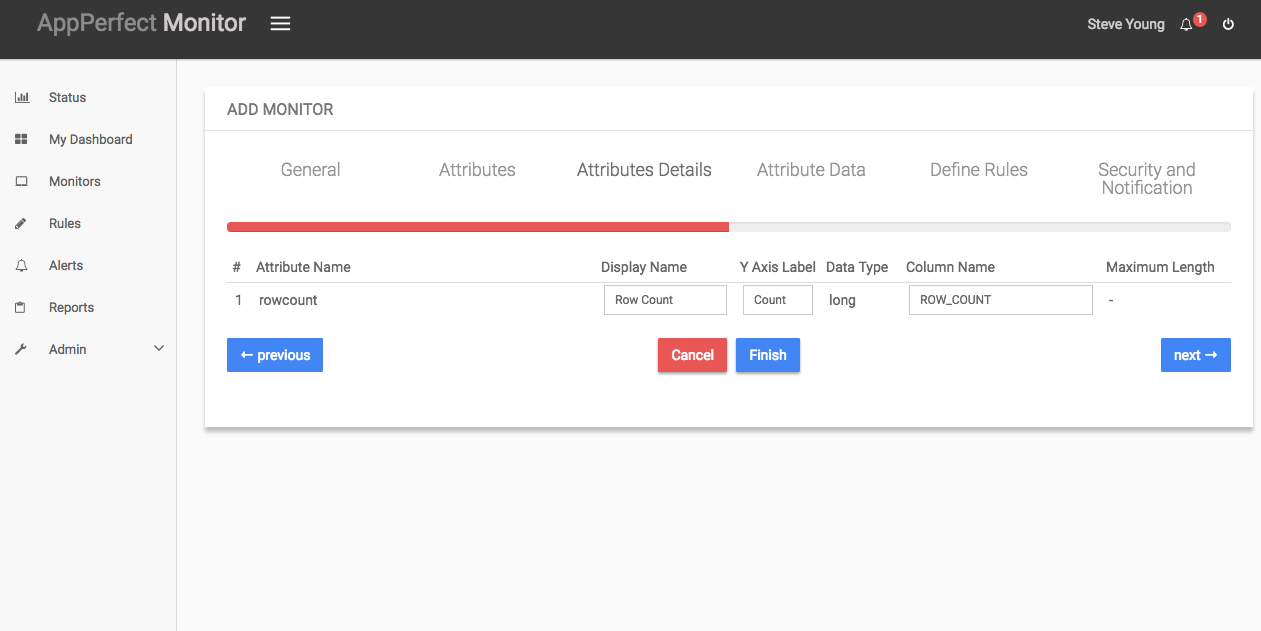
- Next step shows the Attribute details of all the selected attributes in the previous step. You can customize the display labels for each of the attributes here.
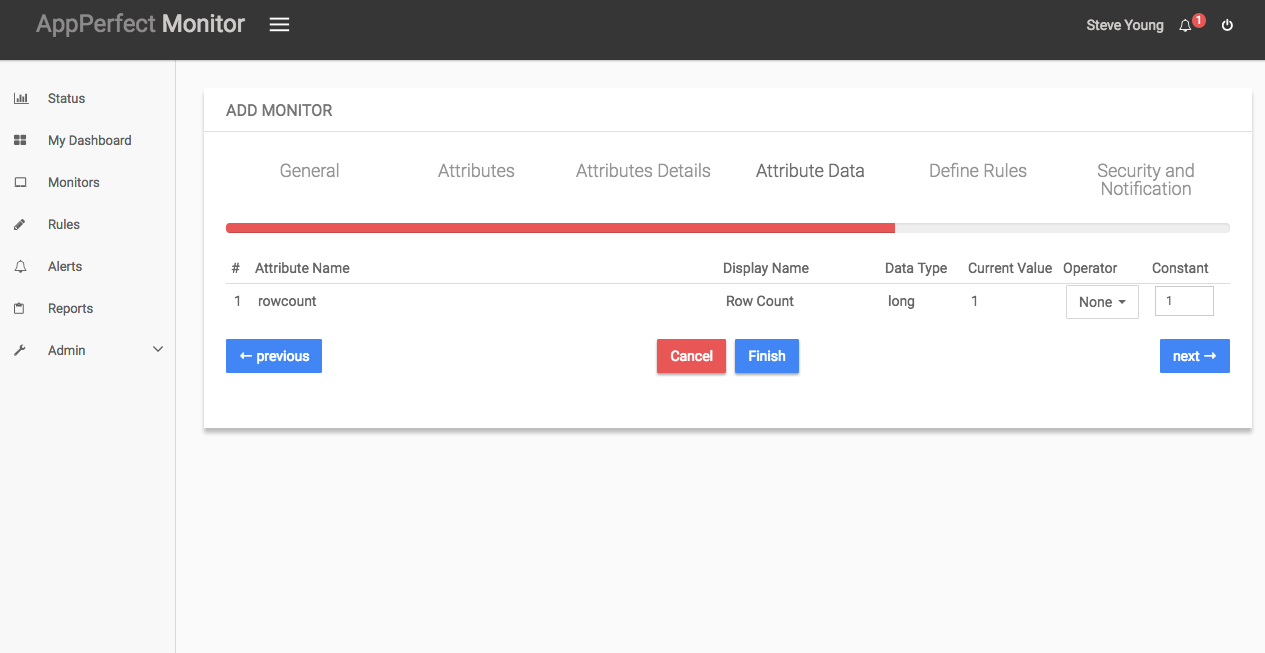
- Next step shows the Attribute Data conversion where you can convert the attribute value to required unit. You can configure the operation which should be performed on the attribute value to create the final output value.
- Next step shows the Defining Rules view. This view will provide a list of all numeric attributes. You can select the attributes for which you want to add a rule. A rule is defined as a conditional or threshold value which when exceeds, a notification would be sent. In a typical workflow the monitors extract data from the monitored device and send it to the rules engine. The rules engine evaluates the data to ensure no rule is violated and then sends it to the view manager. However, if a rule is violated, a message is immediately sent to the notification server to alert the user about the rule violation.Rules can be defined at a later stage as well. For details on how you can add/edit rules for the monitor, please see the Rules chapter.
- Next step shows the Security & Notification settings. When a rule is violated a notification is sent out to all the concerned users that a particular event has occurred and needs to be dealt with. This process is called notification. AppPerfect provides five modes of notification. They are Email notification, SMS notification, Custom notification, Log notification, Database notification, SNMP Trap notification. For details on each of the supported notification , please see the Notification chapter. In this view you can configure the type of notification which should be sent on Rule violation, Users/Groups to whom notification should be sent and also the subject and details on the notification message.
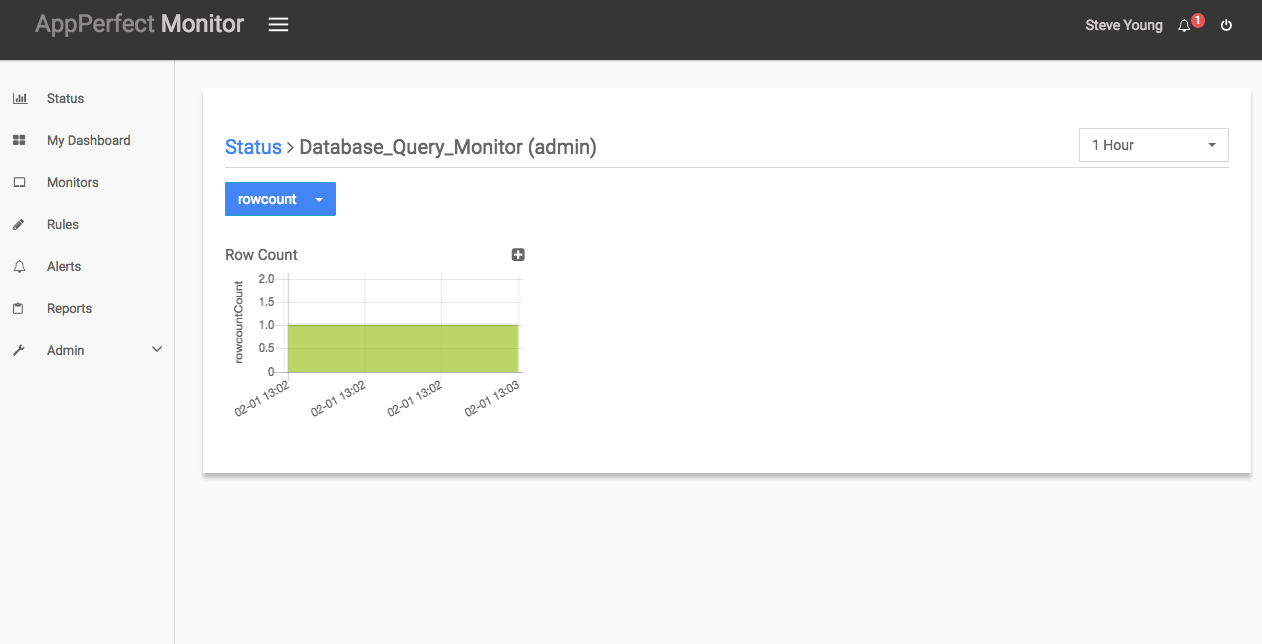
- Click on finish button. We are done adding the monitor for Database Query Monitoring. Once Database Query Monitor is added, you will get a message Database Query Monitor added successfully. Now go to Status. Expand the data for IP provided in IP Address while creating the monitor. Expand database Query Monitor. Click on + icon against the charts that you want to monitor in your Dashboard.