Java Monitoring
The AppPerfect Agentless Monitor can monitor any application or any server running on Java 1.5 or above. It monitors attributes like Heap Memory, Non-Heap Memory, CPU Usage (on some platforms), Classes Loaded, Classes unloaded etc.
AppPerfect's Java Monitoring is the ideal solution to monitor your Java Applications. Java Monitoring with AppPerfect is extremely lightweight and adds negligible overhead to target system while monitoring.
This tutorial provides a brief introduction on monitoring Java Applications using AgentlessMonitor. This tutorial assumes that you have successfully installed AgentlessMonitor and configured remote access to JMX service running in your Java 1.5 or above for the monitoring
Steps to configure Java 1.5 or above for Monitoring
- Open startup file you are using to launch your application or your server.
- Look for line from where you are invoking java command.
- Add "-Dcom.sun.management.jmxremote -Dcom.sun.management.jmxremote.port=<port> -Dcom.sun.management.jmxremote.ssl=false -Dcom.sun.management.jmxremote.authenticate=false" to JVM parameters.
- Please specify any available port in place of <port> in the JVM parameters and make note of this port. You will be required to specify this port number while adding monitor to agentless monitor server.
- If you wish to use authentication then please follow steps give below. If not then skip the following steps:
- Copy JRE_HOME/lib/management/jmxremote.password.template as jmxremote.password in the same directory. Here JRE_HOME is location where "jre" folder is present in the java/jdk you are using.
- Edit the jmxremote.password file. Go to end and Modify:
# monitorRole QED
# controlRole R&D
To
monitorRole QED
controlRole R&D
Note: These roles are defined in JRE_HOME/lib/management/jmxremote.access file. By default monitorRole can only monitor and controlRole can monitor & manage the JVM using JMX approach. By default monitorRole's password is QED & that of controlRole is R&D. Please change it to any appropriate value that you want. We can connect from agentless monitor using monitorRole OR controlRole. If we connect using controlRole we can perform "Manage" action as well. - Set file permissions so that only the owner can read and write the password file.
- Now add "-Dcom.sun.management.jmxremote -Dcom.sun.management.jmxremote.port=<port> -Dcom.sun.management.jmxremote.ssl=false -Dcom.sun.management.jmxremote.authenticate=true" to JVM parameters.
- By default the password file is JRE_HOME/lib/management/jmxremote.password. One can keep it at some other location and specify its path using
-Dcom.sun.management.jmxremote.password.file=
. If you keep is in JRE_HOME/lib/management/ then you don't need to provide "-Dcom.sun.management.jmxremote.password.file".
Configuring Agentless Monitor to monitor the Java Applications
Following steps will explain how you can configure AppPerfect for Java Monitoring :
- Once you are logged into the Monitor Server you can see the Web-UI from which you can access all the features of the Monitor Server. Click the Monitors link from the top navigation bar. This will take you to Monitors tab. Click on Add button to Add a New Java/J2EE Server Monitor.
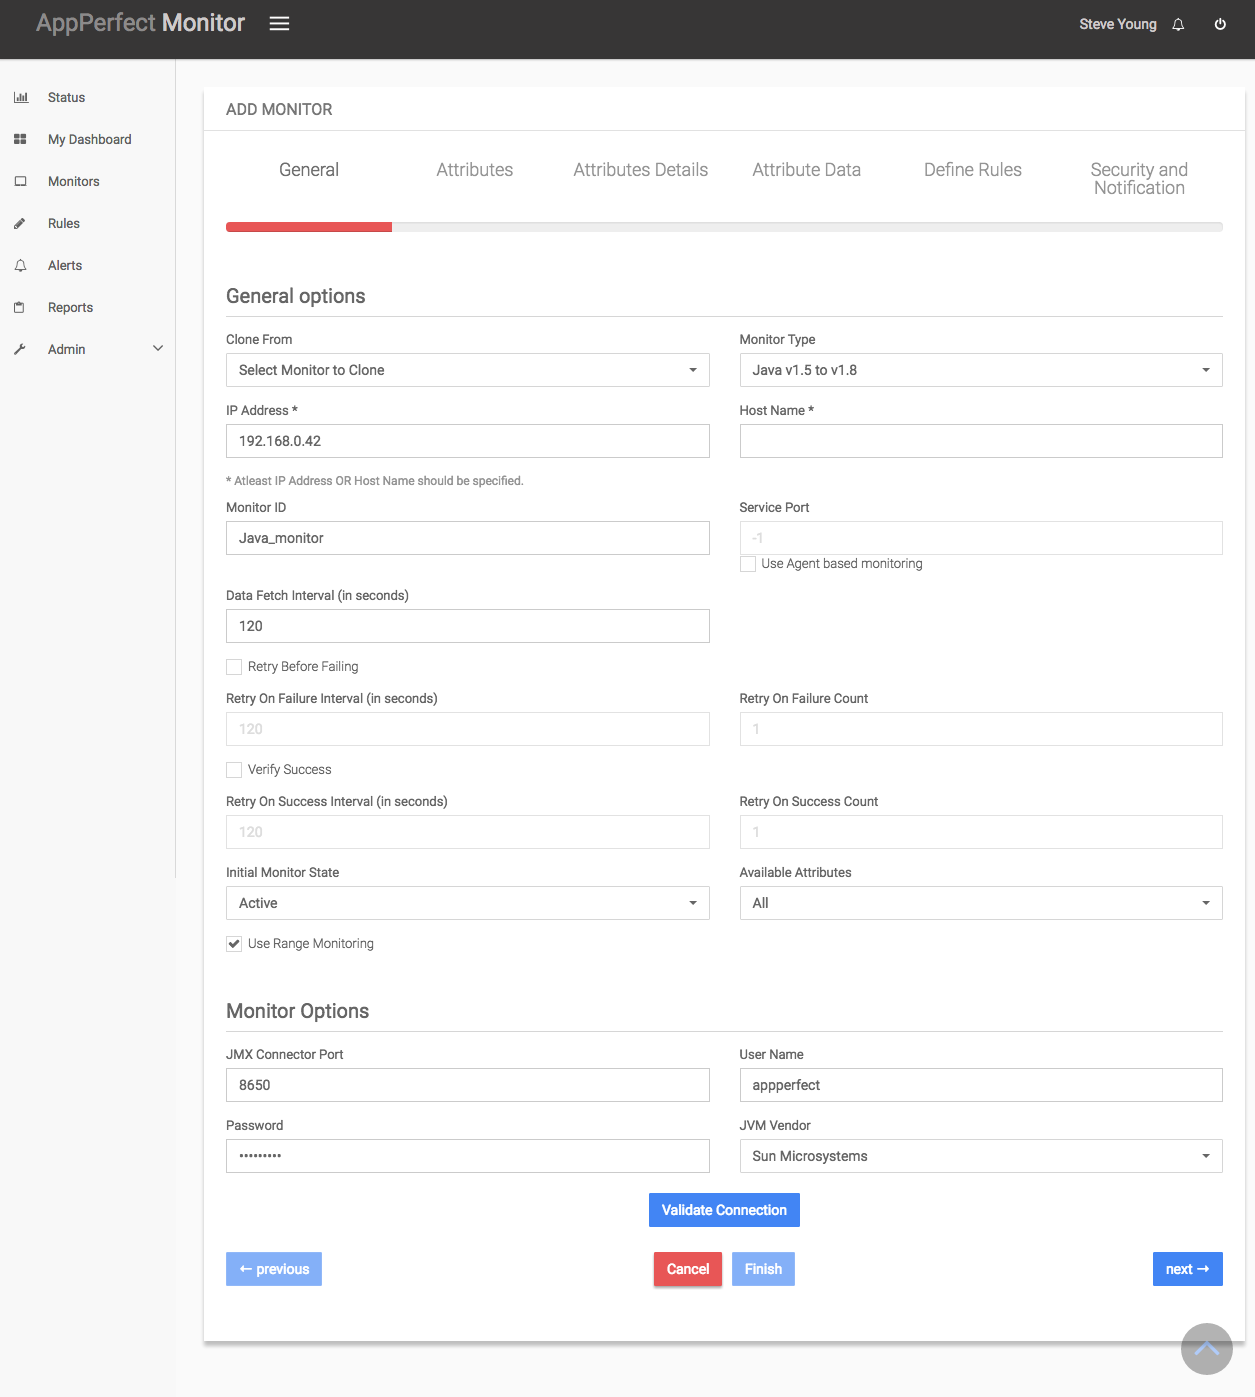
- Next Step is to define the Java Monitor. Provide the IP Address or Host Name of the target java server which needs to be monitored.
- Select the Java/J2EE Servers Monitor Type from the drop down. AppPerfect can monitor Tomcat, Oracle, Jetty, WebLogic, Websphere application servers for performance and robustness. Select Java v1.5 to v1.8 Monitor to monitor Java applications. AppPerfect uses management services provided by application servers to fetch monitoring data. For enabling monitoring services on application server refer to Java/J2EE Monitor chapter.
- Specify a meaningful identifier for the monitor which will help identify the monitor in future.
- Specify the Data Fetch Interval which represents the time interval for which application should wait before fetching the monitoring data from the device. Monitoring Data will be fetched after every specified fetch interval. The smaller the time interval, the more granular the data. However, smaller time intervals also result in a much larger data set.
- You can specify if the monitor should be Active as soon as its added or should it be in suspended state.
- Next Option is to provide application server specific configuration settings. Provide the user credentials and JMX service port configured while configuring application server for monitoring. Once you are done providing the application server settings, click on Validate Connection button to confirm that Java Application is accessible.
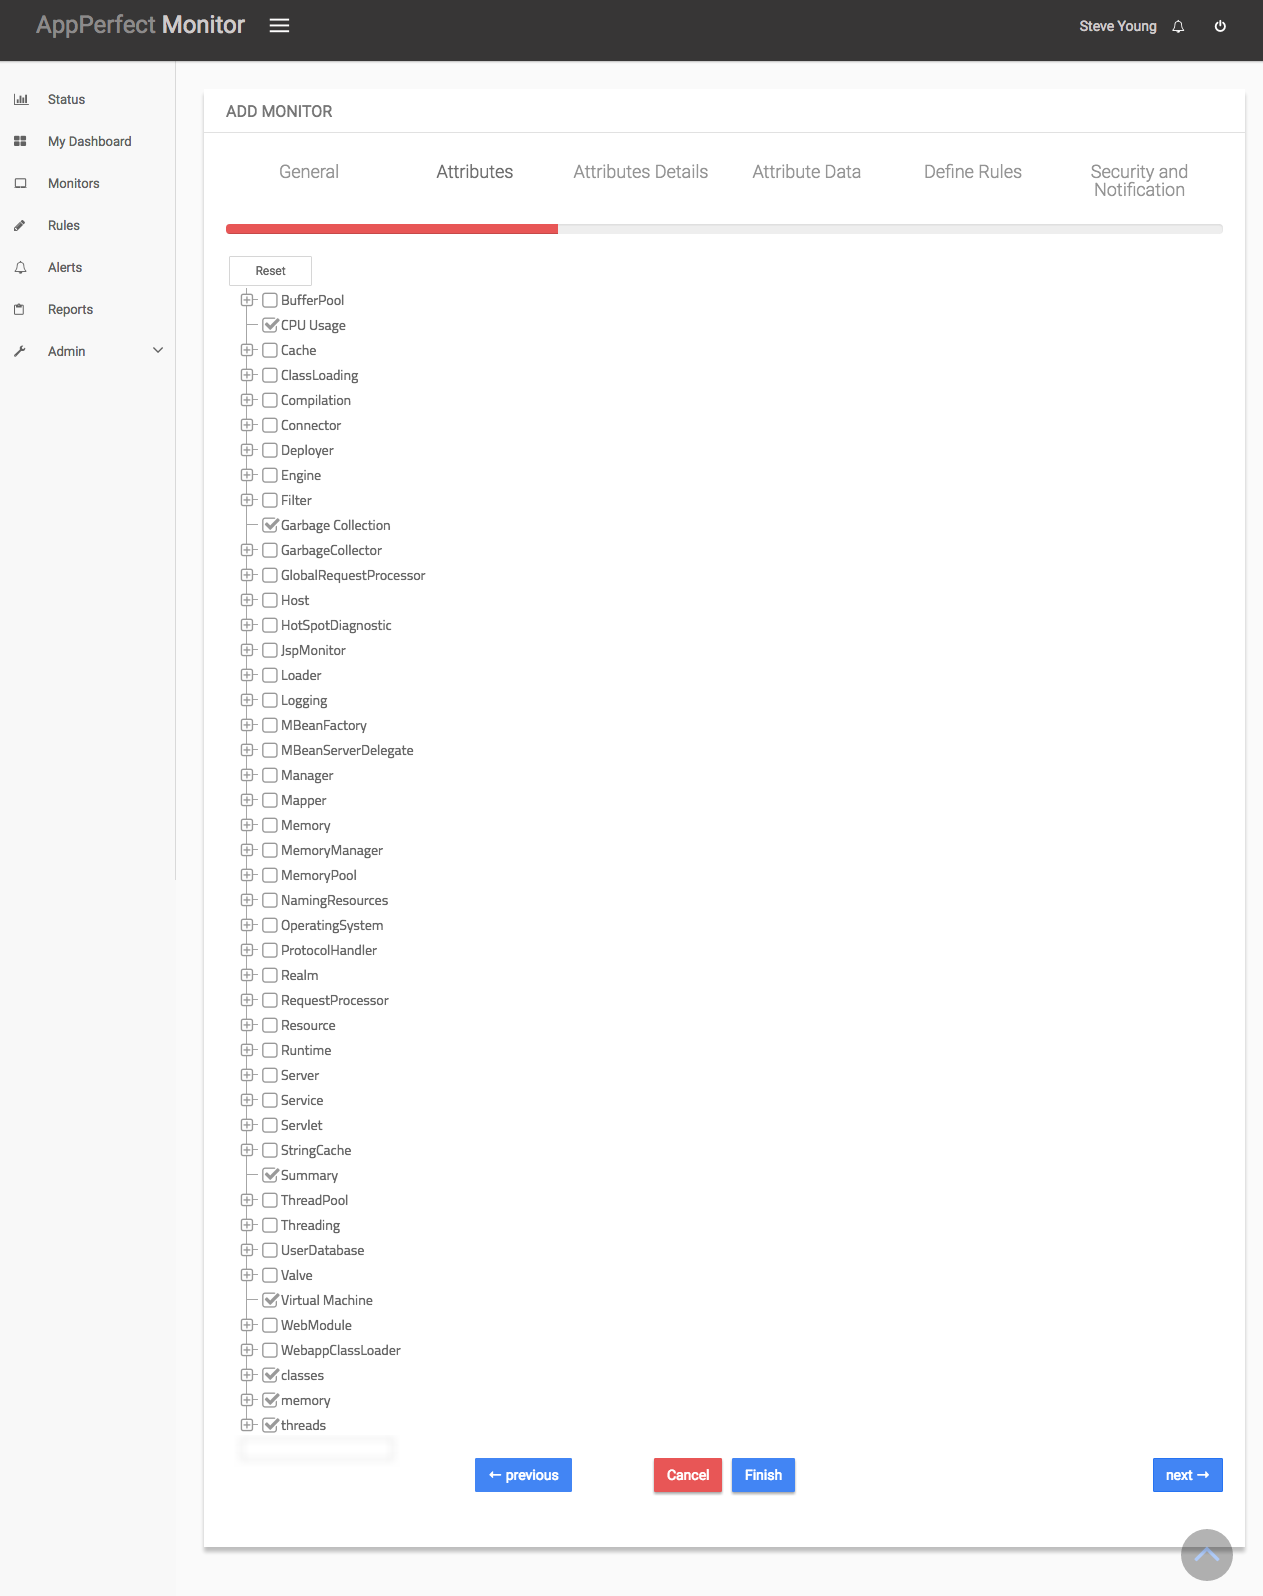
- Next Step is to Select the Attributes to monitor. Java Monitoring allows you to monitor crucial attributes such as attributes like Heap Memory, Non-Heap Memory, CPU Usage (on some platforms), Classes Loaded, Classes unloaded etc. Select the parameters you need to monitor from the list of attributes shown. For details on supported attributes refer to Java/J2EE Monitor chapter.
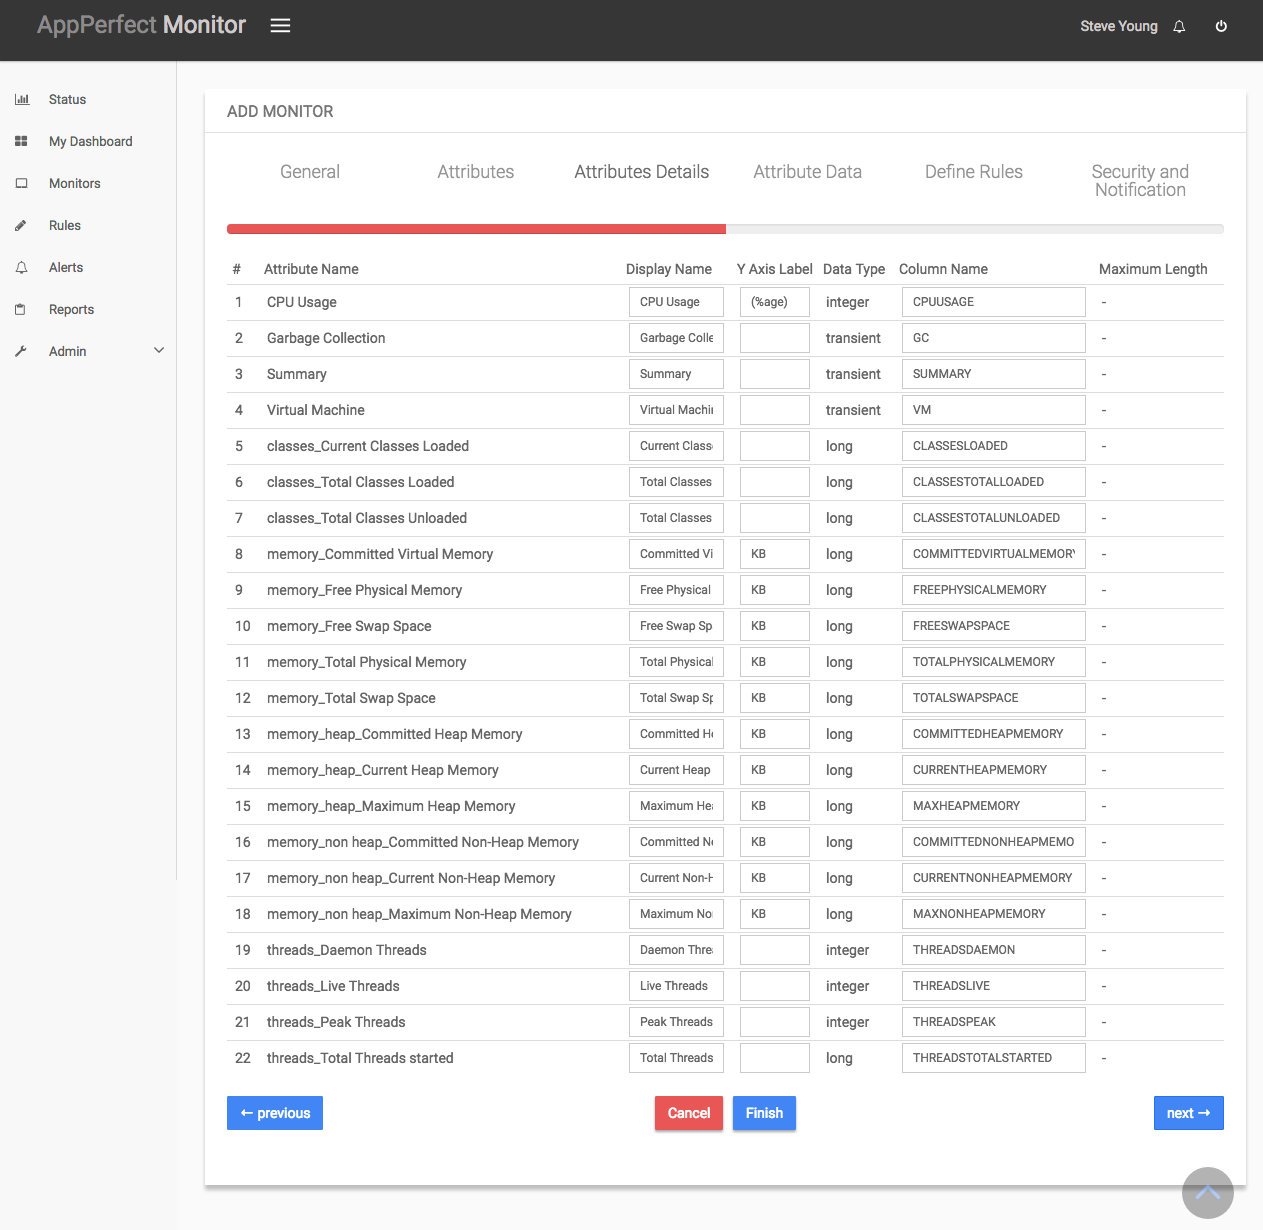
- Next step shows the Attribute details of all the selected attributes in the previous step. You can customize the display labels for each of the attributes here. You can change the label for time from milliseconds to microseconds.
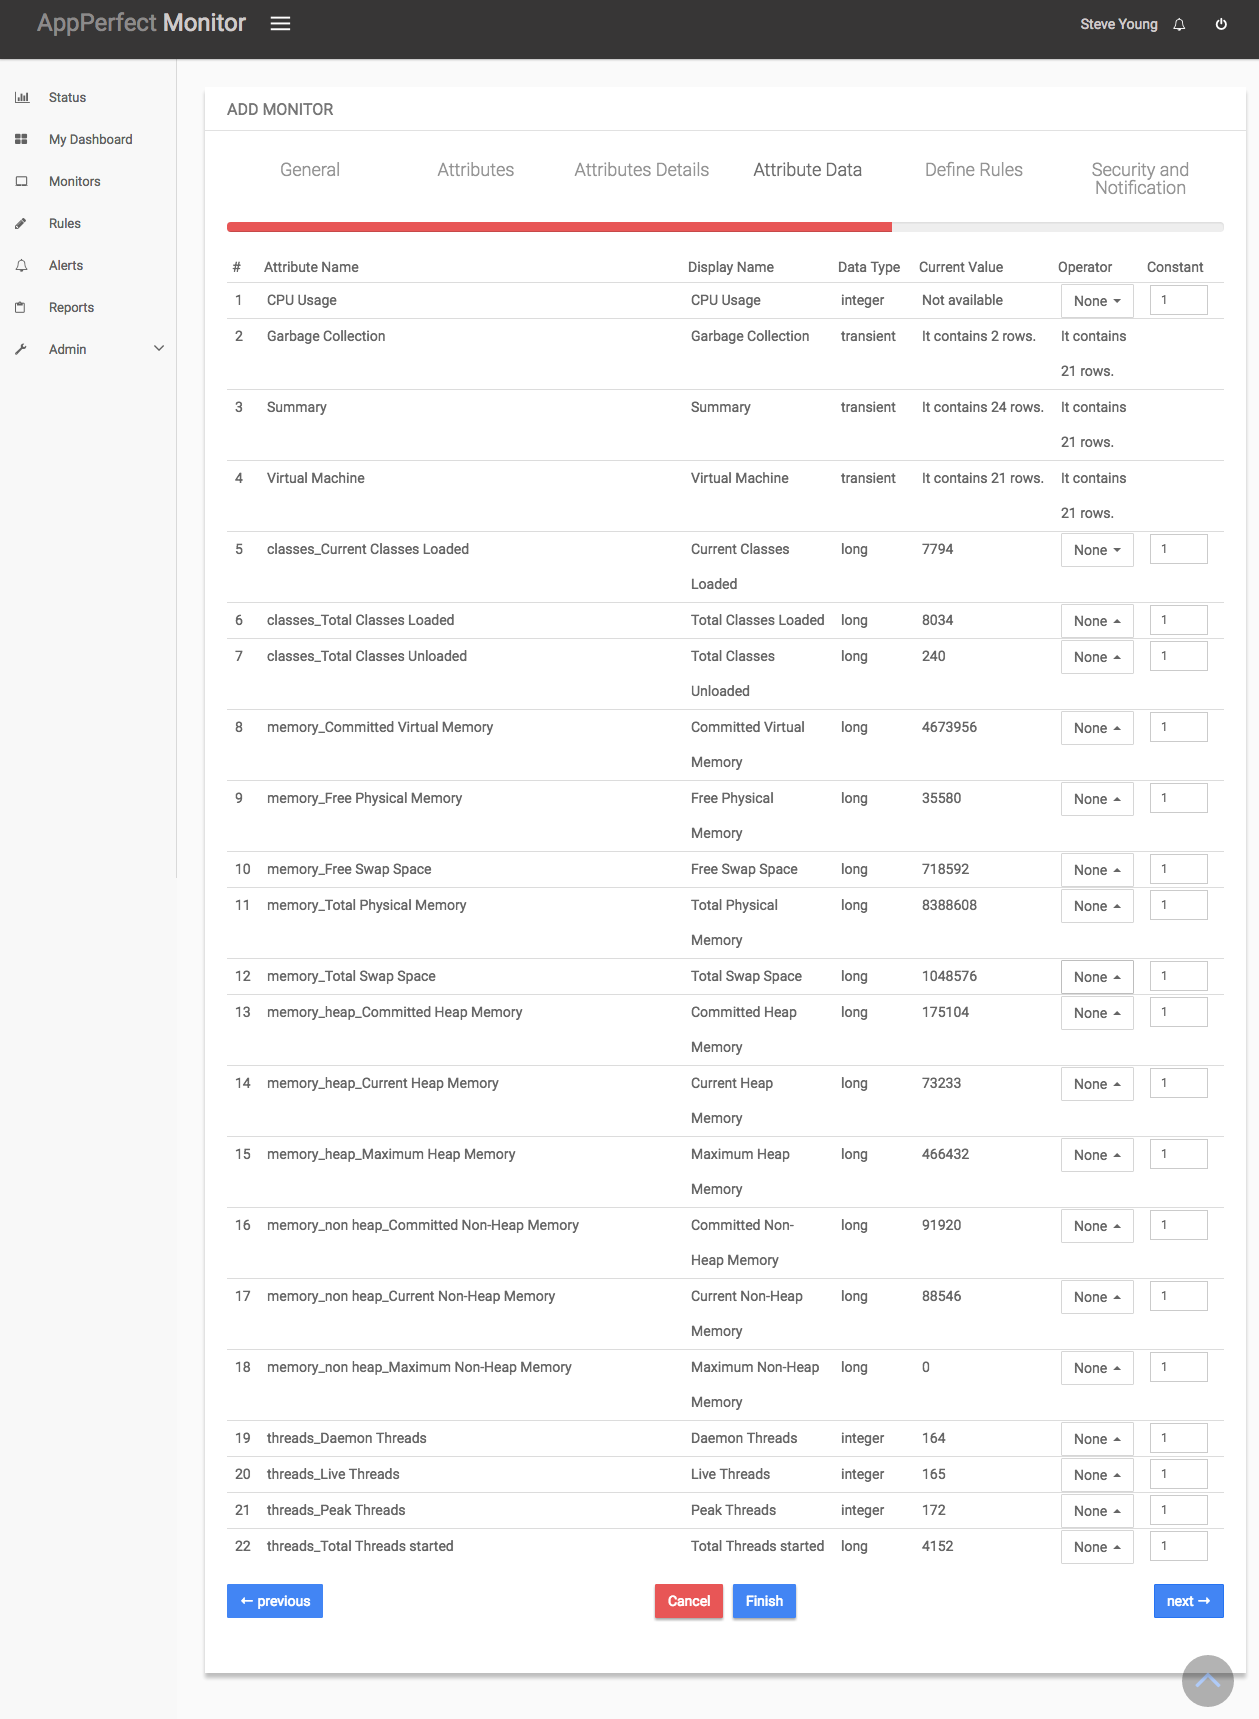
- Next step shows the Attribute Data conversion where you can convert the attribute value to required unit. You can configure the operation which should be performed on the attribute value to create the final output value. For example by default the JSP Load Time is in milliseconds. In case you need to convert the values to micro seconds, you can set an operator to convert the value from milli seconds to micro seconds. In this case it will be a Multiply operation by 1000.
- Next step shows the Defining Rules view. This view will provide a list of all numeric attributes. You can select the attributes for which you want to add a rule. A rule is defined as a conditional or threshold value which when exceeds, a notification would be sent. In a typical workflow the monitors extract data from the monitored device and send it to the rules engine. The rules engine evaluates the data to ensure no rule is violated and then sends it to the view manager. However, if a rule is violated, a message is immediately sent to the notification server to alert the user about the rule violation.Rules can be defined at a later stage as well. For details on how you can add/edit rules for the monitor, please see the Rules chapter.
- Next step shows the Security & Notification settings. When a rule is violated a notification is sent out to all the concerned users that a particular event has occurred and needs to be dealt with. This process is called notification. AppPerfect provides five modes of notification. They are Email notification, SMS notification, Custom notification, Log notification, Database notification, SNMP Trap notification. For details on each of the supported notification , please see the Notification chapter. In this view you can configure the type of notification which should be sent on Rule violation, Users/Groups to whom notification should be sent and also the subject and details on the notification message.
- Click on finish button. We are done adding the monitor for Java Monitoring. Once Java Monitor is added, you will get a message Java Monitor added successfully. Now go to Status. Expand the data for IP provided in IP Address while creating the monitor. Expand Java monitor. Click on + icon against the charts that you want to monitor in your Dashboard.