Exception/Error Monitoring
Exception/Error Monitoring is a process to monitor the log files generated by the applications, events, and services to identify the errors or exceptions occurred in the applications running. Exception/Error Monitoring helps in identifying the errors by scanning the log files for specific keyword/text pattern and generate alerts to notify the user.
Serious errors like OutOfMemoryError get logged into server's log files which makes server not perform its usual operations in desired manner even though it continues to run. The Exception/Error monitor will watch your server's log files and alert you as soon as it finds pre-configured search conditions.
This tutorial provides a brief introduction on monitoring Log files using AgentlessMonitor. This tutorial assumes that you have successfully installed AgentlessMonitor.
Configuring Agentless Monitor to monitor Exception/Error in log files
Following steps will explain how you can configure AppPerfect Agentless Monitor for Exception/Error Monitoring :
- Once you are logged into the Monitor Server you can see the Web-UI from which you can access all the features of the Monitor Server. Click the Monitors link from the left sidebar. This will take you to Monitors tab. Click on Add button to Add a New Exception/Error Monitor.
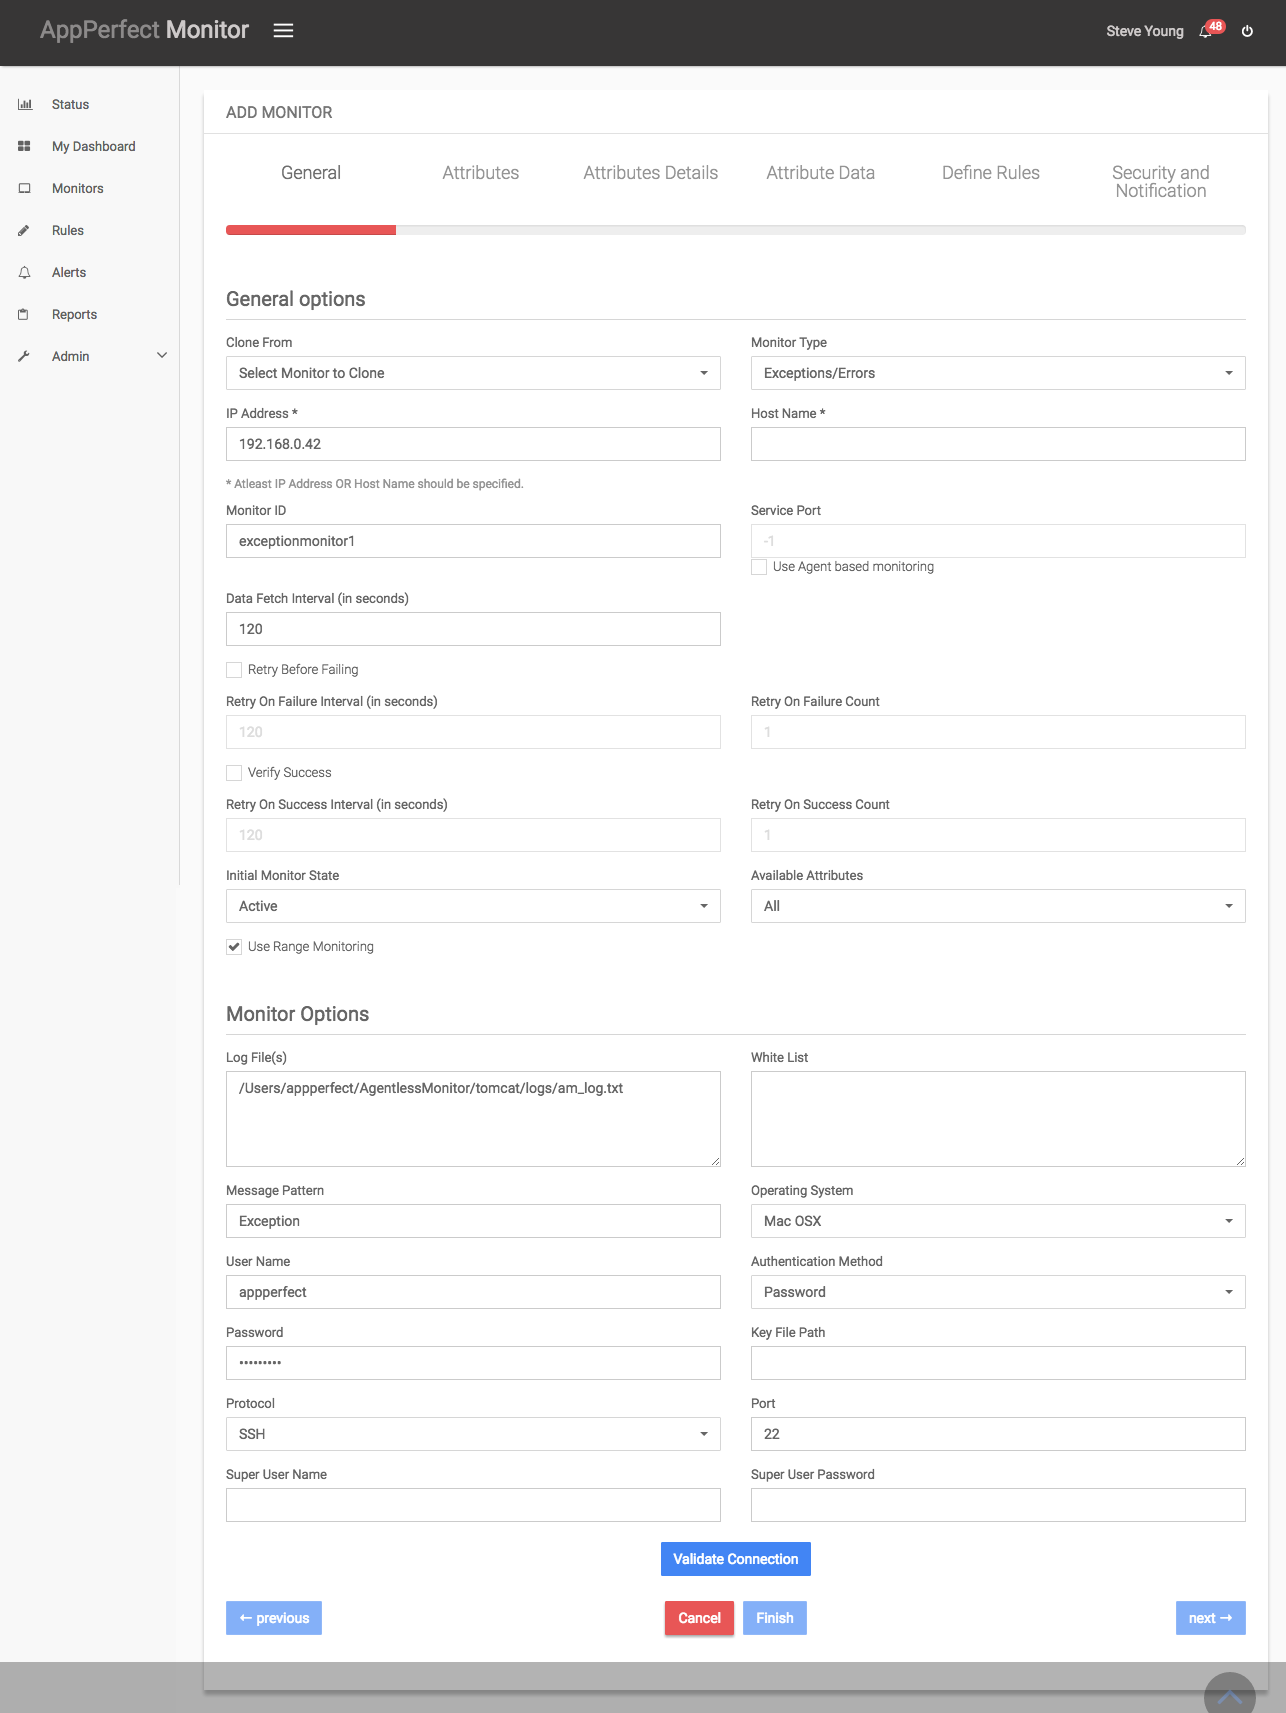
- Next Step is to define the Exception/Error Monitor. Provide the IP Address or Host Name of the system whose log files need to be monitored.
- Select the monitor type as Exception/Error Monitor to monitor Logs for errors or exceptions.
- Specify a meaningful identifier for the monitor which will help identify the monitor in future. AppPerfect also supports legacy agent-based architecture. In case you need to use agent-based monitoring, AppPerfect can provide agent for monitoring remote machine, in which case it requires the agent to be deployed on remote machine running at a specific port.
- Specify the Data Fetch Interval which represents the time interval for which application should wait before fetching the monitoring data from the device. Monitoring Data will be fetched after every specified fetch interval. The smaller the time interval, the more granular the data. However, smaller time intervals also result in a much larger data set.
- You can specify if the monitor should be Active as soon as its added or should it be in suspended state. You can also specify if all the attributes should be monitored or only some predefined attributes should be monitored.
- Next Option is to provide server specific configuration settings. Provide the log file(s) you want to monitor, message pattern and user credentials. You can add some keywords to the whitelist, so the monitor will ignore those patterns while monitoring. Once you are done providing the server settings, click on Validate Connection button to confirm that the specified log file(s) on the server is accessible.
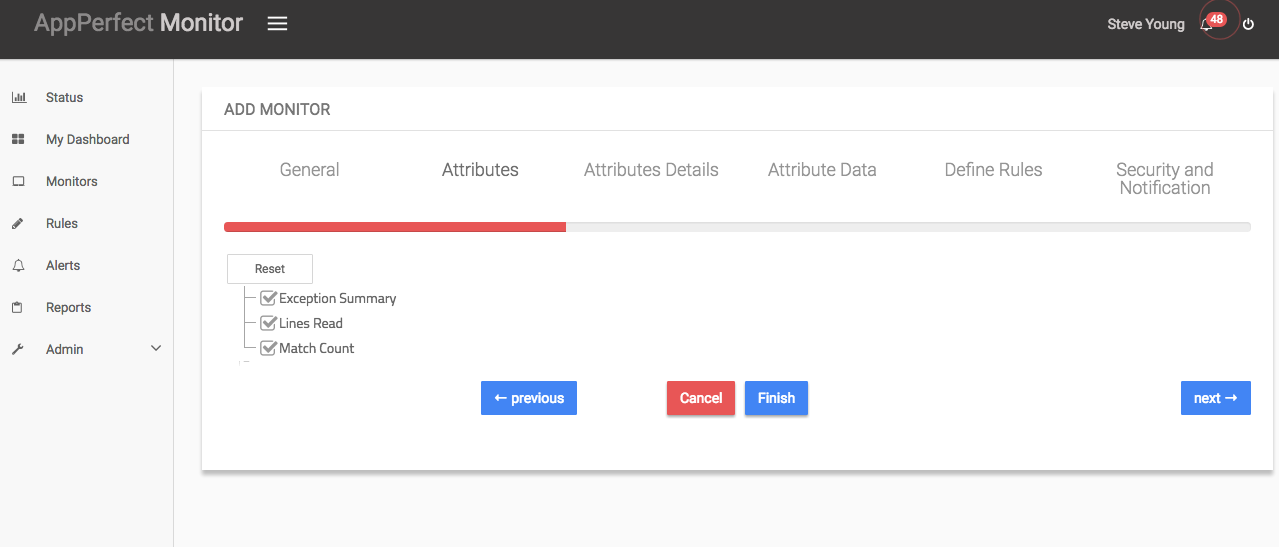
- Next Step is to Select the Attributes to monitor. Exception/Error Monitoring allows you to monitor the parameters such as lines read, exception summary, match count etc. Select the parameters you need to monitor from the list of attributes shown.
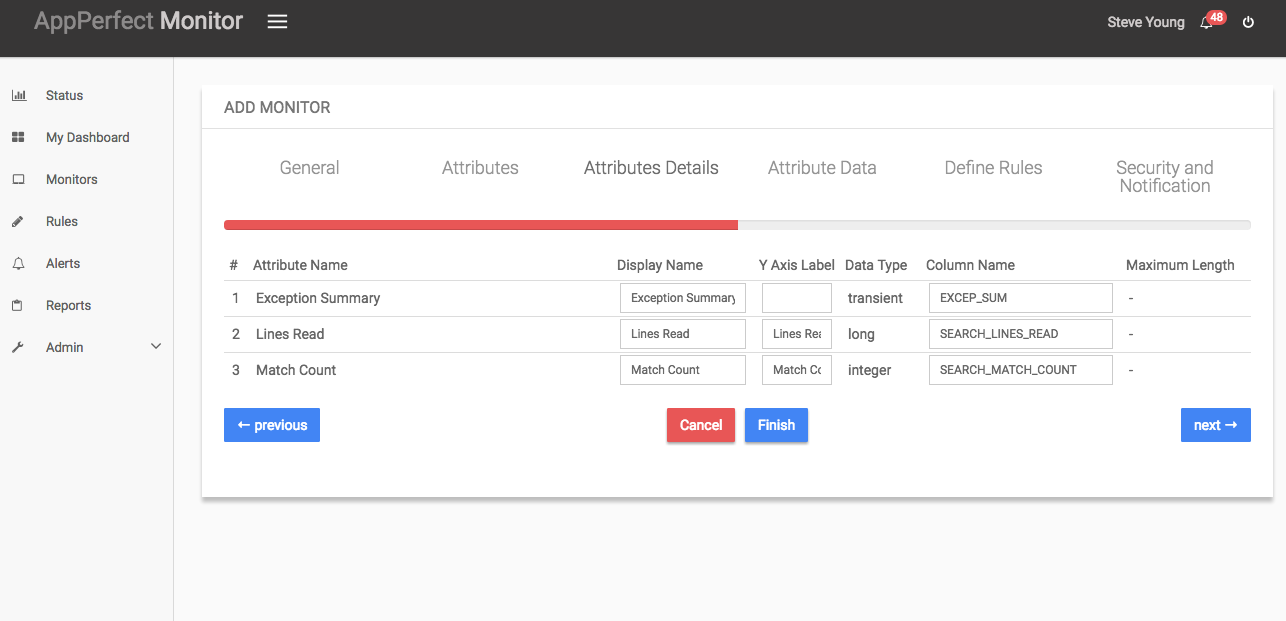
- Next step shows the Attribute details of all the selected attributes in the previous step. You can customize the display labels for each of the attributes here. You can change the label for time from milliseconds to microseconds.
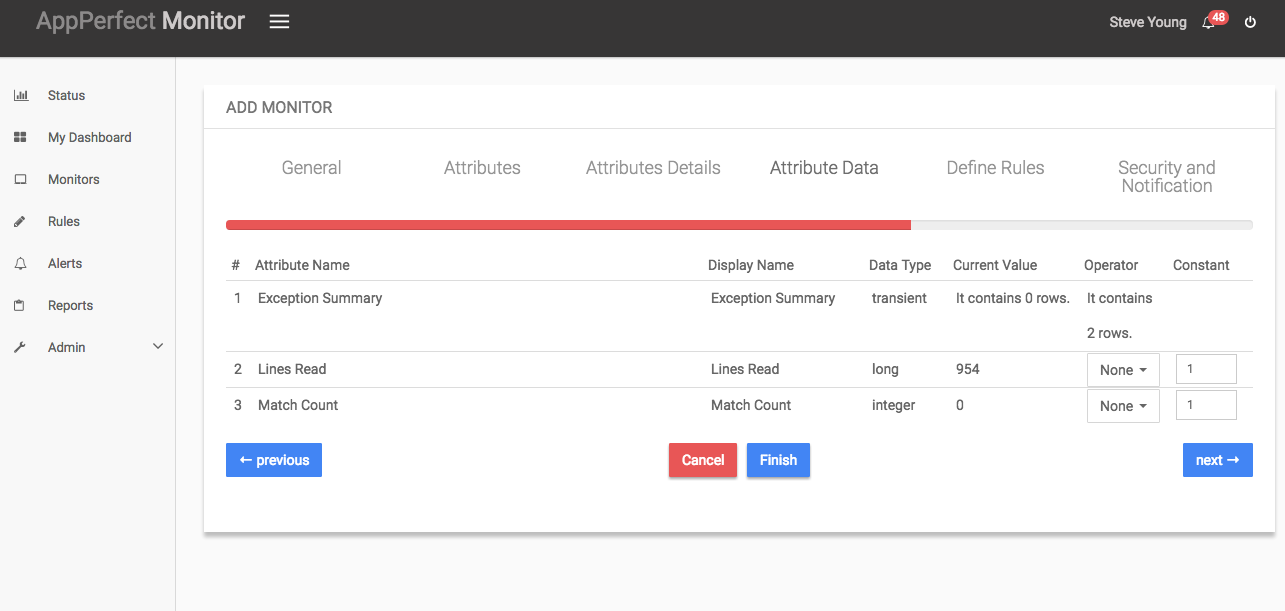
- Next step shows the Attribute Data conversion where you can convert the attribute value to required unit. You can configure the operation which should be performed on the attribute value to create the final output value.
- Next step shows the Defining Rules view. This view will provide a list of all numeric attributes. You can select the attributes for which you want to add a rule. A rule is defined as a conditional or threshold value which when exceeds, a notification would be sent. In a typical workflow the monitors extract data from the monitored device and send it to the rules engine. The rules engine evaluates the data to ensure no rule is violated and then sends it to the view manager. However, if a rule is violated, a message is immediately sent to the notification server to alert the user about the rule violation.Rules can be defined at a later stage as well. For details on how you can add/edit rules for the monitor, please see the Rules chapter.
- Next step shows the Security & Notification settings. When a rule is violated a notification is sent out to all the concerned users that a particular event has occurred and needs to be dealt with. This process is called notification. AppPerfect provides five modes of notification. They are Email notification, SMS notification, Custom notification, Log notification, Database notification, SNMP Trap notification. For details on each of the supported notification , please see the Notification chapter. In this view you can configure the type of notification which should be sent on Rule violation, Users/Groups to whom notification should be sent and also the subject and details on the notification message.
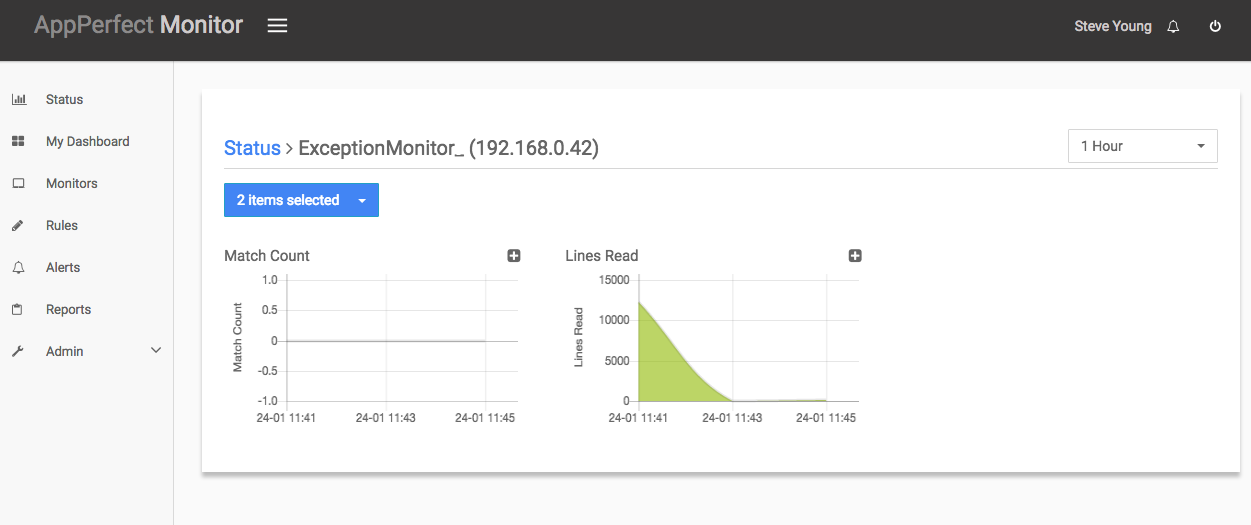
- Click on finish button. We are done adding the monitor for Exception/Error Monitoring. Once Exception/Error Monitor is added, you will get a message Exception/Error Monitor added successfully. Now go to Status. Expand the data for IP provided in IP Address while creating the monitor. Expand Exception/Error monitor. Click on + icon against the charts that you want to monitor in your Dashboard.