Kafka Server Monitoring
Kafka is a distributed, partitioned, replicated, log service developed by LinkedIn and open sourced in 2011. Basically it is a massively scalable pub/sub message queue architected as a distributed transaction log.
Kafka Monitoring is a process to monitor rate of incoming and outgoing messages and bytes, fetch request rate of consumer and follower, number of controllers, CPU usage, number of partitions and lag time. AppPerfect offers Kafka Server Monitoring solution in the form of AppPerfect Agentless Monitor. AppPerfect's Kafka Server Monitoring is the ideal solution to monitor your Kafka server's parameters. Kafka Server Monitoring with AppPerfect is extremely lightweight and adds negligible overhead to target system while monitoring.
This tutorial provides a brief introduction on monitoring Kafka using AgentlessMonitor. This tutorial assumes that you have successfully installed AgentlessMonitor and Kafka to be monitored is of version 0.8.
Monitored Attributes
| Metrics | Description | Data type |
| BrokerTopicMetrics.BytesInPerSec.Count | Rate of incoming bytes | long |
| BrokerTopicMetrics.BytesOutPerSec.Count | Rate of outgoing bytes | long |
| BrokerTopicMetrics.BytesRejectedPerSec.Count | Rate of rejected bytes | long |
| BrokerTopicMetrics.FailedFetchRequestsPerSec.Count | Rate of failed fetch requests | long |
| BrokerTopicMetrics.FailedProduceRequestsPerSec.Count | Rate of failed produce requests | long |
| BrokerTopicMetrics.MessagesInPerSec.Count | Rate of incoming messages | long |
| ControllerStats.LeaderElectionRateAndTimeMs.Count | Leader election rate and latency | long |
| ControllerStats.UncleanLeaderElectionsPerSec.Count | Number of "unclean" elections per second | long |
| FetchRequestPurgatory.PurgatorySize.Value | Number of requests waiting in fetch purgatory | double |
| KafkaController.ActiveControllerCount.Value | No. of active controllers | double |
| KafkaController.OfflinePartitionsCount.Value | No. of offline partitions | double |
| KafkaRequestHandlerPool.RequestHandlerAvgIdlePercent.Count | The average fraction of time the request handler threads are idle | long |
| ProducerRequestPurgatory.PurgatorySize.Value | Number of requests waiting in producer purgatory | double |
| ReplicaManager.IsrExpandsPerSec.Count | Rate at which the pool of in-sync replicas (ISRs) expands | long |
| ReplicaManager.IsrShrinksPerSec.Count | Rate at which the pool of in-sync replicas (ISRs) shrinks | long |
| ReplicaManager.LeaderCount.Value | Leader replica counts | long |
| ReplicaManager.PartitionCount.Value | Partition counts | double |
| ReplicaManager.UnderReplicatedPartitions.Value | Number of unreplicated partitions | double |
| ReplicaFetcherManager.MaxLag.Replica.Value | Max lag in messages between follower and leader replicas | double |
| RequestMetrics.RequestsPerSec.FetchConsumer.Count | Consumer fetch request rate | long |
| RequestMetrics.RequestsPerSec.FetchFollower.Count | Follower fetch request rate | long |
| RequestMetrics.RequestsPerSec.Produce.Count | Produce request rate | long |
Requirements for Integration with AgentlessMonitor
In order to monitor Kafka with AM, JMX should be enabled and Kafka servers should have JMX_PORT configured before starting broker (or consumer or producer). Verify by connecting to that port on JConsole. Verify the connection for ZooKeeper as well by using the following command:
ruok: echo ruok | nc
The zookeeper port is usually 2181. If ZooKeeper responds with imok, proceed to add monitor.
Configuring Agentless Monitor to monitor Kafka version 0.8
Following steps will explain how you can configure AppPerfect for Kafka Server Monitoring :
- Once you are logged into the Monitor Server you can see the Web-UI from which you can access all the features of the Monitor Server. Click the Monitors link from the left sidebar. This will take you to Monitors tab. Click on Add button to Add a New Kafka Server Monitor.
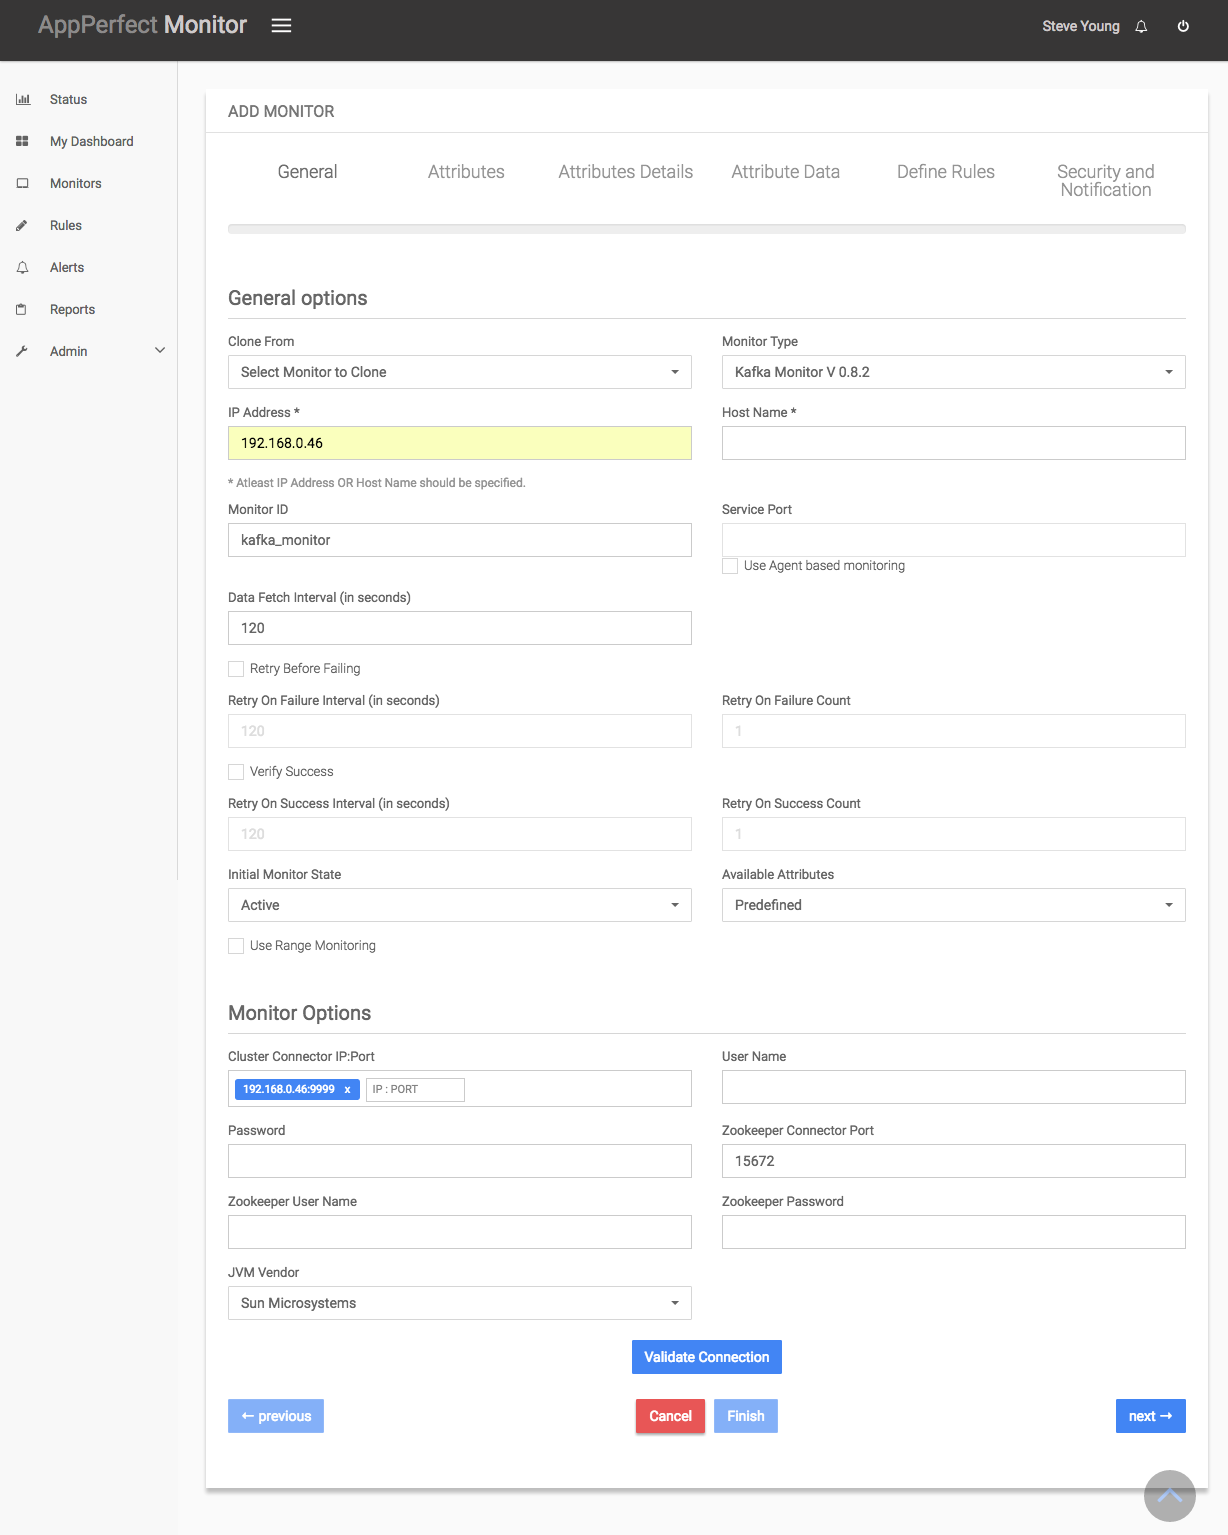
- Next Step is to define the Kafka Server Monitor. Provide the IP Address or Host Name of the target Kafka server whose resources needs to be monitored.
- Select the monitor type as Kafka to monitor Kafka.
- Specify a meaningful identifier for the monitor which will help identify the monitor in future. AppPerfect also supports legacy agent-based architecture. In case you need to use agent-based monitoring, AppPerfect can provide agent for monitoring remote machine, in which case it requires the agent to be deployed on remote machine running at a specific port.
- Specify the Data Fetch Interval which represents the time interval for which application should wait before fetching the monitoring data from the device. Monitoring Data will be fetched after every specified fetch interval. The smaller the time interval, the more granular the data. However, smaller time intervals also result in a much larger data set.
- You can specify if the monitor should be Active as soon as its added or should it be in suspended state. You can also specify if all the attributes should be monitored or only some predefined attributes should be monitored.
- Next Option is to provide Cluster Connector IP:Port i.e. list of Kafka server's IP and JMX ports, Zookeeper port. Besides configuring your hosts, you may also need to modify user, and password for servers as well as zookeeper. Ensure that Kafka server is running at the moment and validate the connection by clicking on Validate Connection button.
-
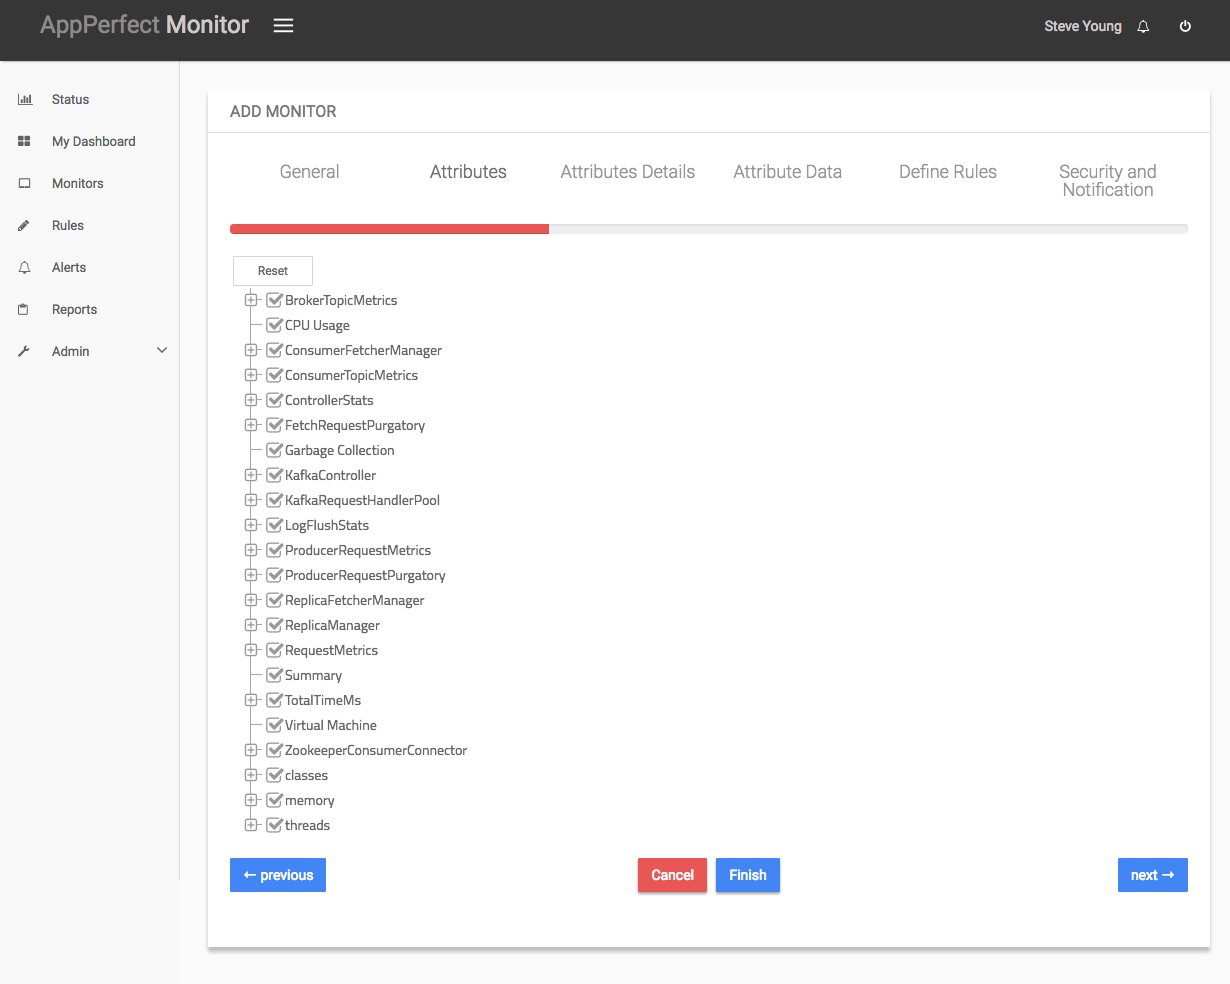
Next Step is to Select the Attributes to monitor. Kafka Server monitoring allows you to monitor crucial parameters such as broker topic metrics, CPU usage, consumer fetcher metrics etc. Select the parameters you need to monitor from the list of attributes shown. For details on supported attributes refer to Server Monitor chapter.
-
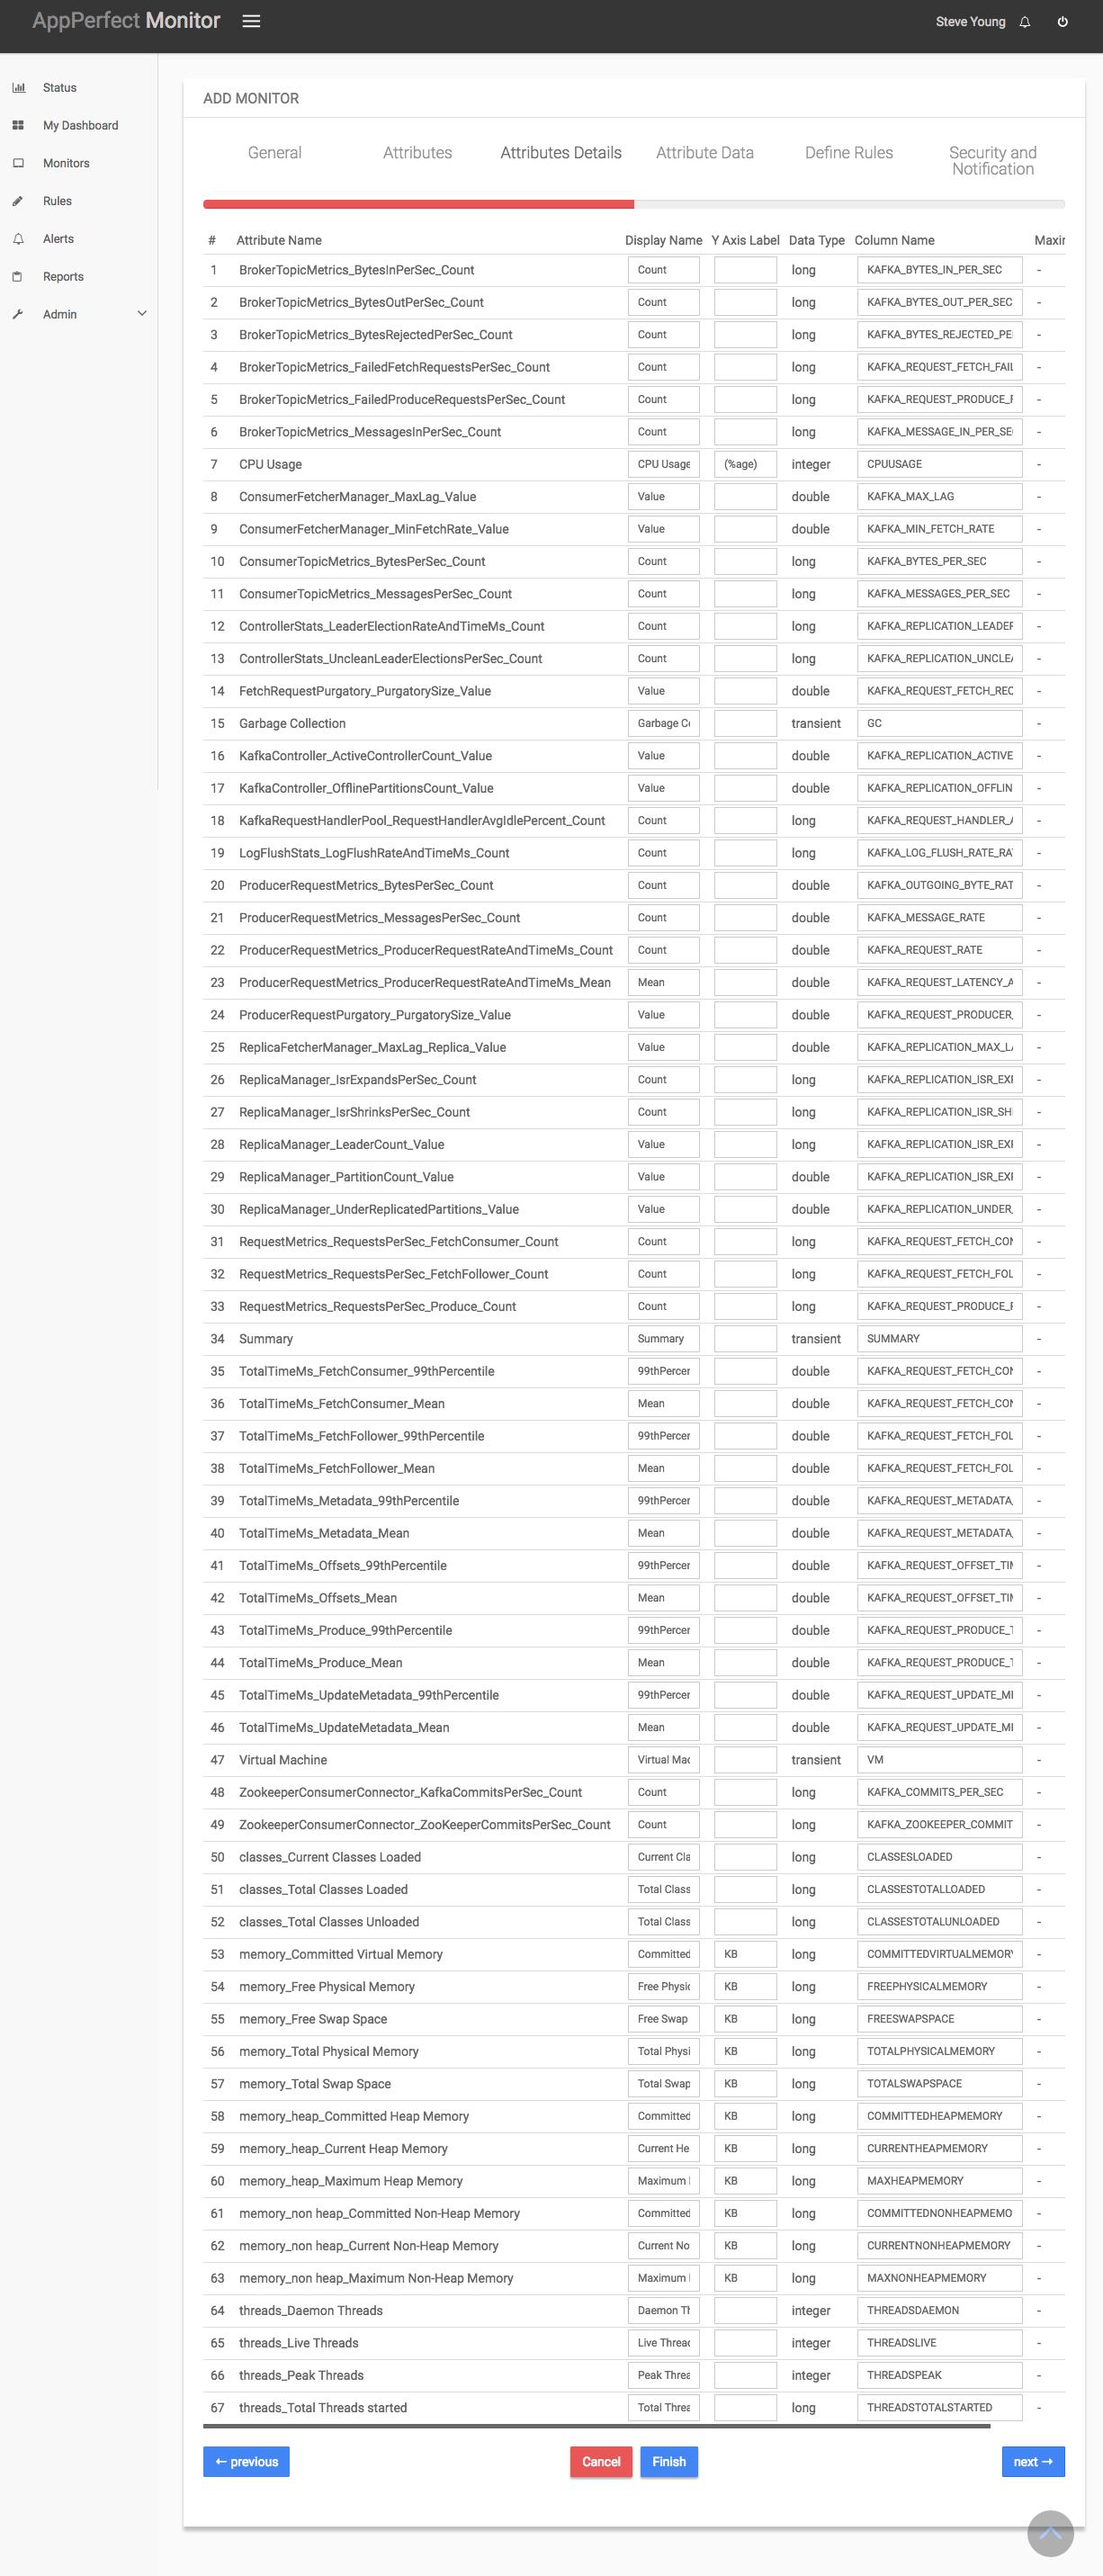
Next step shows the Attribute details of all the selected attributes in the previous step. You can customize the display labels for each of the attributes here.
-
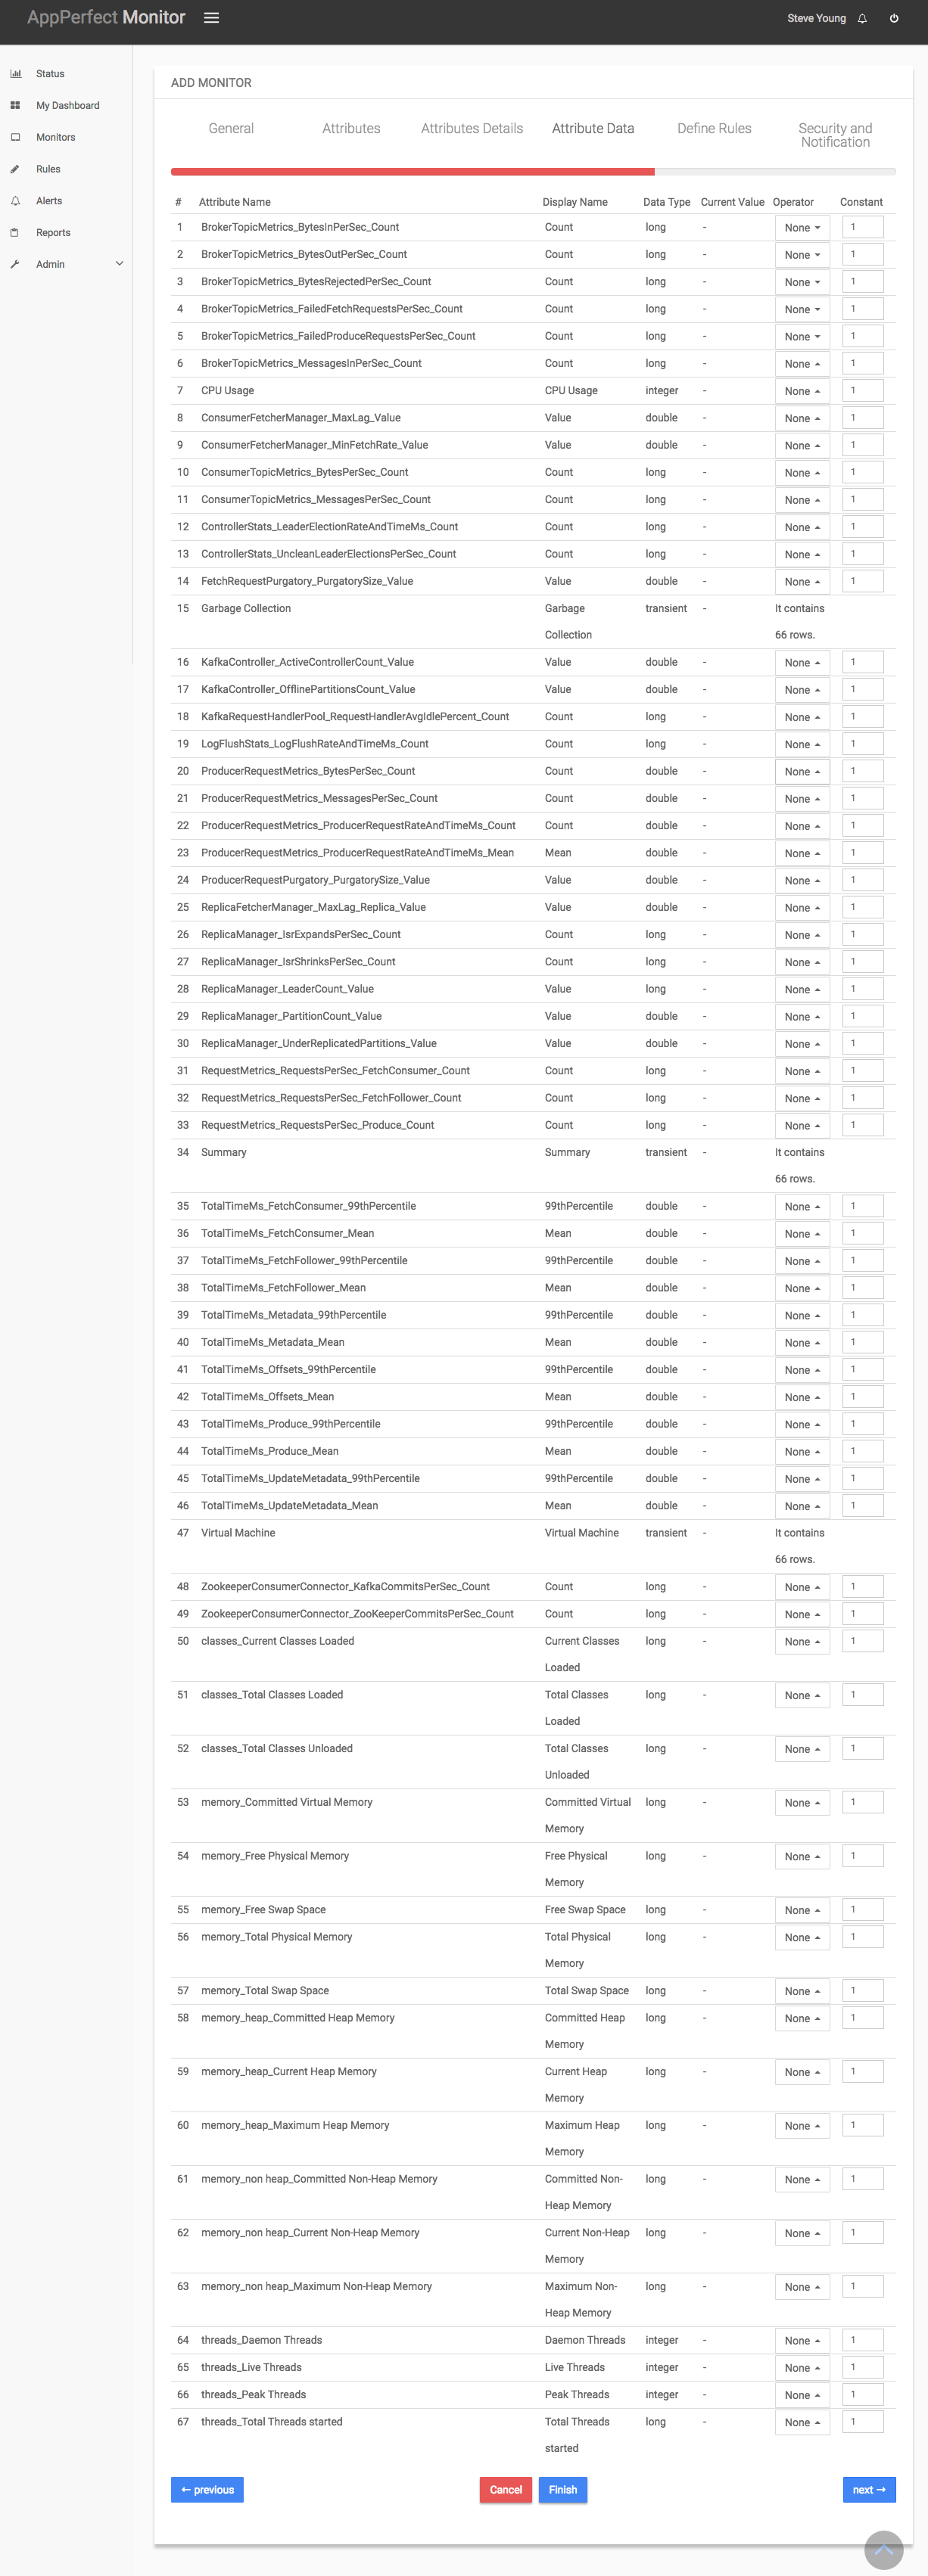
Next step shows the Attribute Data conversion where you can convert the attribute value to required unit. You can configure the operation which should be performed on the attribute value to create the final output value. For example by default the Available Physical Memory is in MegaBytes(MB). In case you need to convert the values to KiloBytes (KB), you can set an operator to convert the value from MB to KB. In this case it will be a Multiply operation by 1024.
- Next step shows the Defining Rules view. This view will provide a list of all numeric attributes. You can select the attributes for which you want to add a rule. A rule is defined as a conditional or threshold value which when exceeds, a notification would be sent. In a typical workflow the monitors extract data from the monitored device and send it to the rules engine. The rules engine evaluates the data to ensure no rule is violated and then sends it to the view manager. However, if a rule is violated, a message is immediately sent to the notification server to alert the user about the rule violation. Rules can be defined at a later stage as well. For details on how you can add/edit rules for the monitor, please see the Rules chapter.
- Next step shows the Security & Notification settings. When a rule is violated a notification is sent out to all the concerned users that a particular event has occurred and needs to be dealt with. This process is called notification. AppPerfect provides five modes of notification. They are Email notification, SMS notification, Custom notification, Log notification, Database notification, SNMP Trap notification. For details on each of the supported notification, please see the Notification chapter. In this view you can configure the type of notification which should be sent on Rule violation, Users/Groups to whom notification should be sent and also the subject and details on the notification message.
-
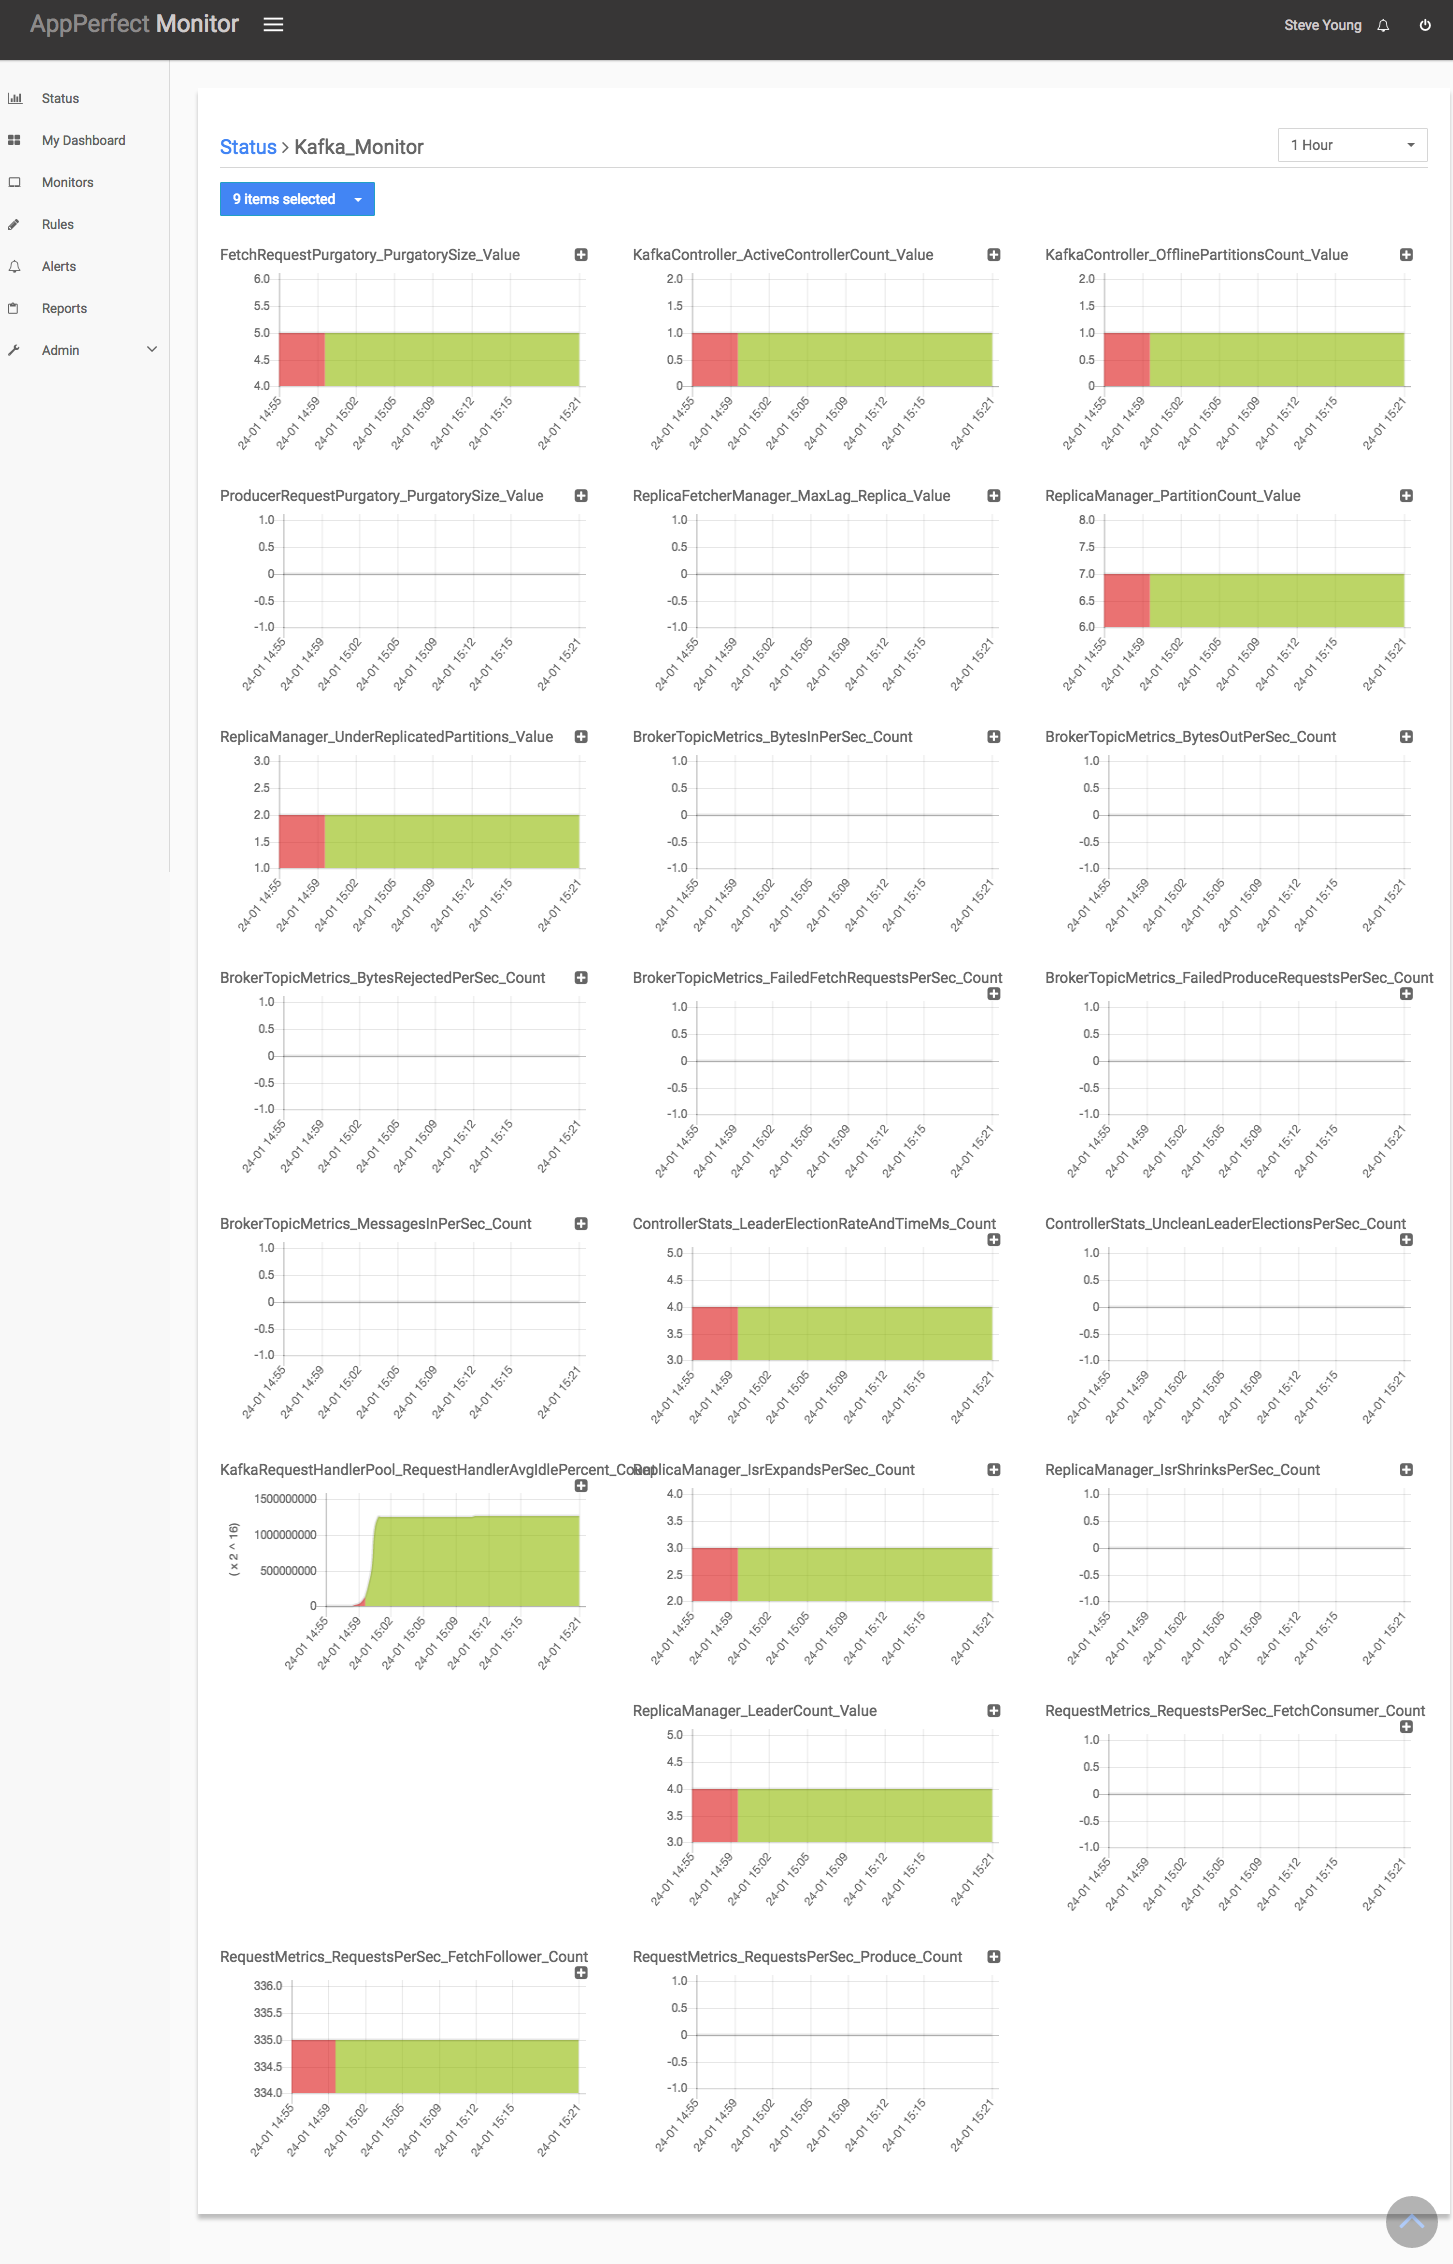
Click on finish button. We are done adding the monitor for Kafka Server Monitoring. Once Kafka Monitor V 0.8.2 Monitor is added, you will get a message TestKafka added successfully. Now go to Status. Expand the data for IP provided in IP Address while creating the monitor. Expand Kafka monitor. Click on + icon against the charts that you want to monitor in your Dashboard.