Linux Server Monitoring
Linux Server Monitoring is a process to monitor Linux's system resources like CPU Usage, Memory Consumption, I/O, Network, Disk Usage, Process etc. AppPerfect offers Linux Server Monitoring solution in the form of AppPerfect Agentless Monitor. AppPerfect's Linux Server Monitoring is the ideal solution to monitor your Linux server's resources. Linux Server Monitoring with AppPerfect is extremely lightweight and adds negligible overhead to target system while monitoring.
This tutorial provides a brief introduction on monitoring Linux operating system using AgentlessMonitor.
Monitored Attributes
| Attribute Name | Data Type | Description |
| CPU_Load Average(1 min) | integer | |
| CPU_Load Average(15 min) | integer | |
| CPU_Load Average(5 min) | integer | |
| CPU_System CPU Usage | integer | |
| CPU_Total CPU Usage | integer | |
| CPU_User CPU Usage | integer | |
| CPU_Wait CPU Usage | integer | |
| logical disk_Total Space | float | |
| logical disk_Total Used Space | float | |
| network interface_Network Utilization | float | |
| network interface_Total Network Data Received | float | |
| network interface_Total Network Data Sent | float | |
| physical disk_Total Disk Reads | float | |
| physical disk_Total Disk Writes | float | |
| physical memory_Total Physical Memory | integer | |
| physical memory_Used Physical Memory | integer | |
| processes | transient | |
| virtual memory_Total Virtual Memory | integer | |
| virtual memory_Used Virtual Memory | integer |
Configuring Agentless Monitor to monitor Linux's system resources
Following steps will explain how you can configure AppPerfect for Linux Server Monitoring :
- Once you are logged into the Monitor Server you can see the Web-UI from which you can access all the features of the Monitor Server. Click the Monitors link from the left sidebar. This will take you to Monitors tab. Click on Add button to Add a New Linux Server Monitor.
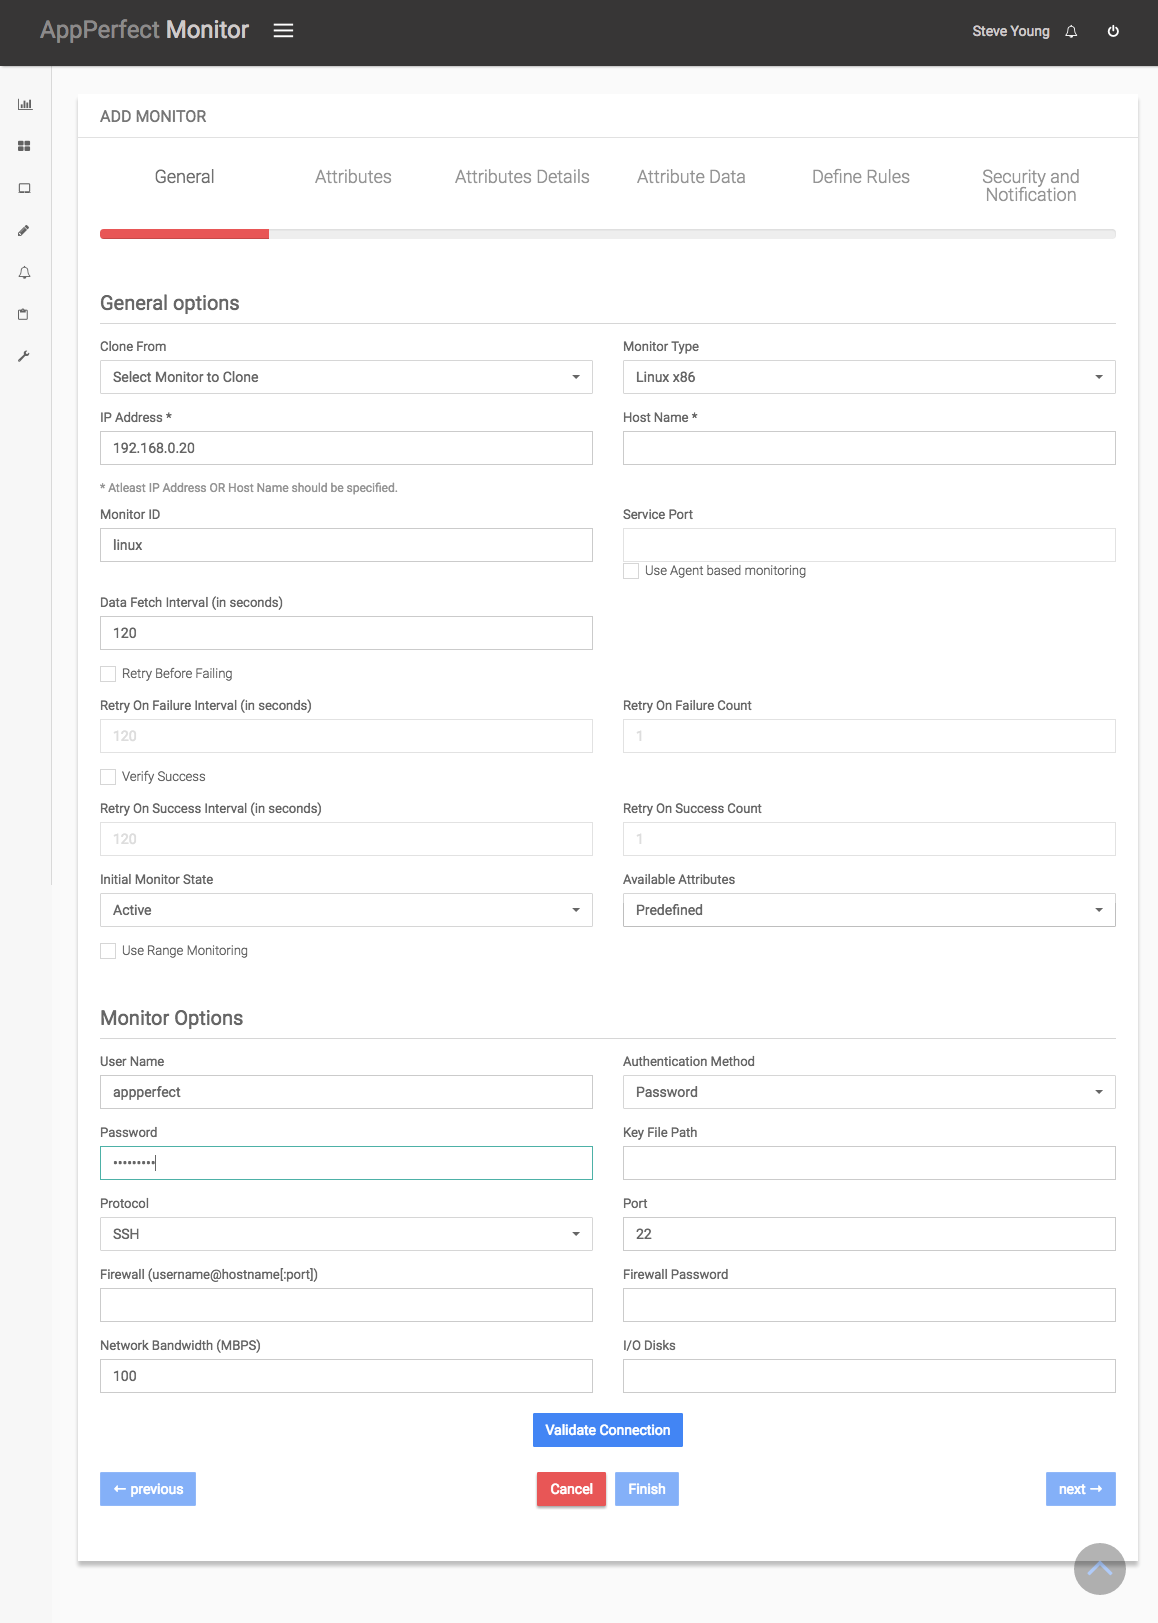
- Next Step is to define the Linux Server Monitor. Provide the IP Address or Host Name of the target Linux server whose resources needs to be monitored.
- Select the Server Monitor Type from the drop down. AppPerfect supports monitoring for Microsoft Windows 2000/XP/2003, Linux x86, Solaris Sparc, Mac OSX and AIX Systems. Select the monitor type as Linux x86 to monitor Linux resources.
- Specify a meaningful identifier for the monitor which will help identify the monitor in future. AppPerfect also supports legacy agent-based architecture. In case you need to use agent-based monitoring, AppPerfect can provide agent for monitoring remote machine, in which case it requires the agent to be deployed on remote machine running at a specific port.
- Specify the Data Fetch Interval which represents the time interval for which application should wait before fetching the monitoring data from the device. Monitoring Data will be fetched after every specified fetch interval. The smaller the time interval, the more granular the data. However, smaller time intervals also result in a much larger data set.
- You can specify if the monitor should be Active as soon Las its added or should it be in suspended state. You can also specify if all the attributes should be monitored or only some predefined attributes should be monitored.
- Next Option is to provide user credentials and protocol for accessing remote machine. For Linux machine, select the protocol (Telnet, SSH or Rstat) which should be used to get the monitor data. Once you are done providing the credentials, click on Validate Connection button to confirm that monitored device is accessible.
-
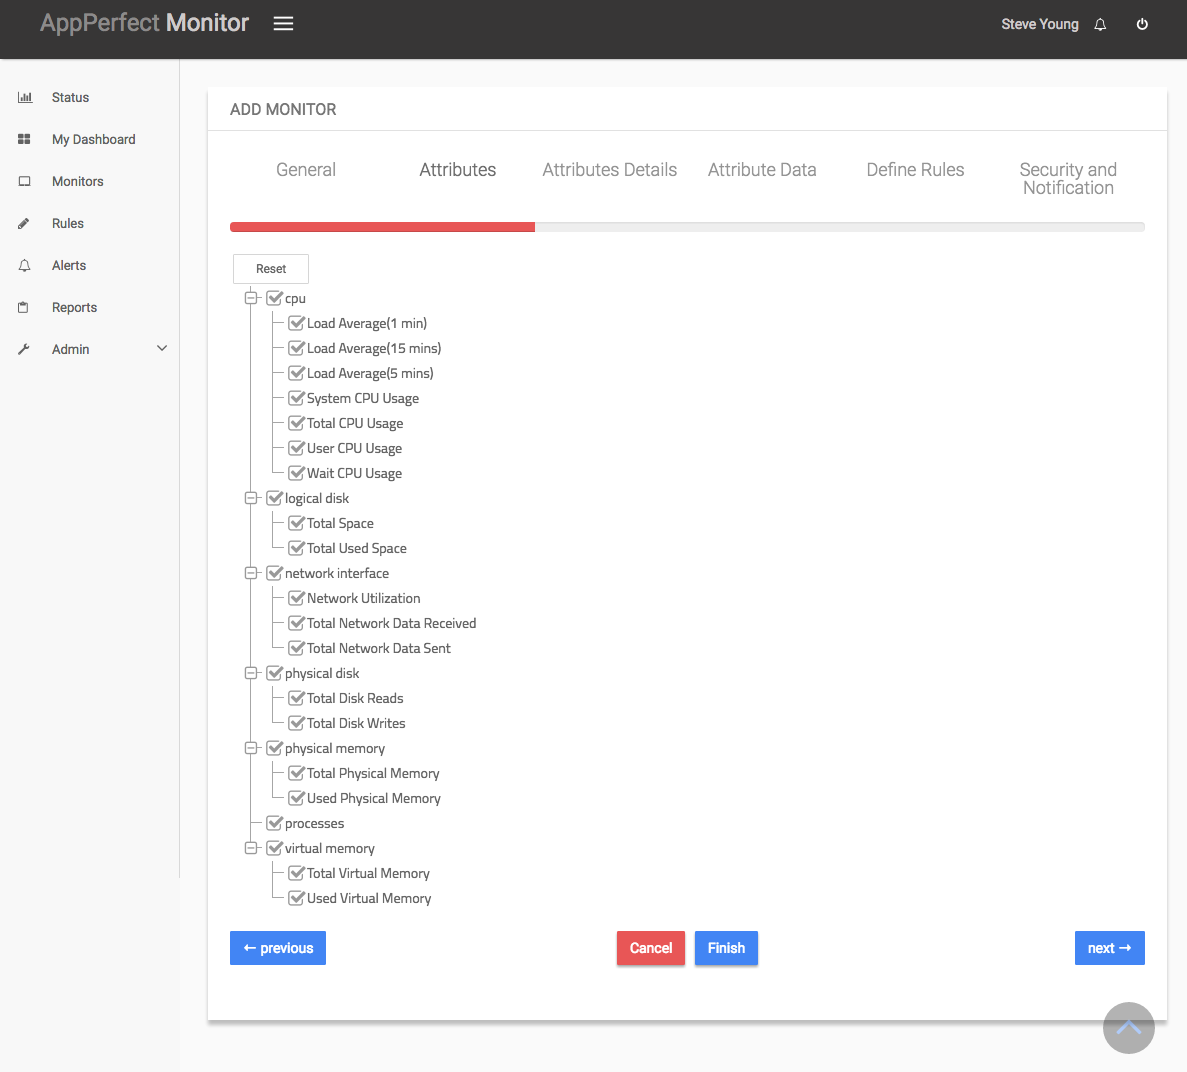
Next Step is to Select the Attributes to monitor. Linux Server monitoring allows you to monitor crucial parameters such as CPU usage, Memory consumption, Network, Disk usage and Processes that are running on the system. Select the parameters you need to monitor from the list of attributes shown. For details on supported attributes refer to Server Monitor chapter.
-
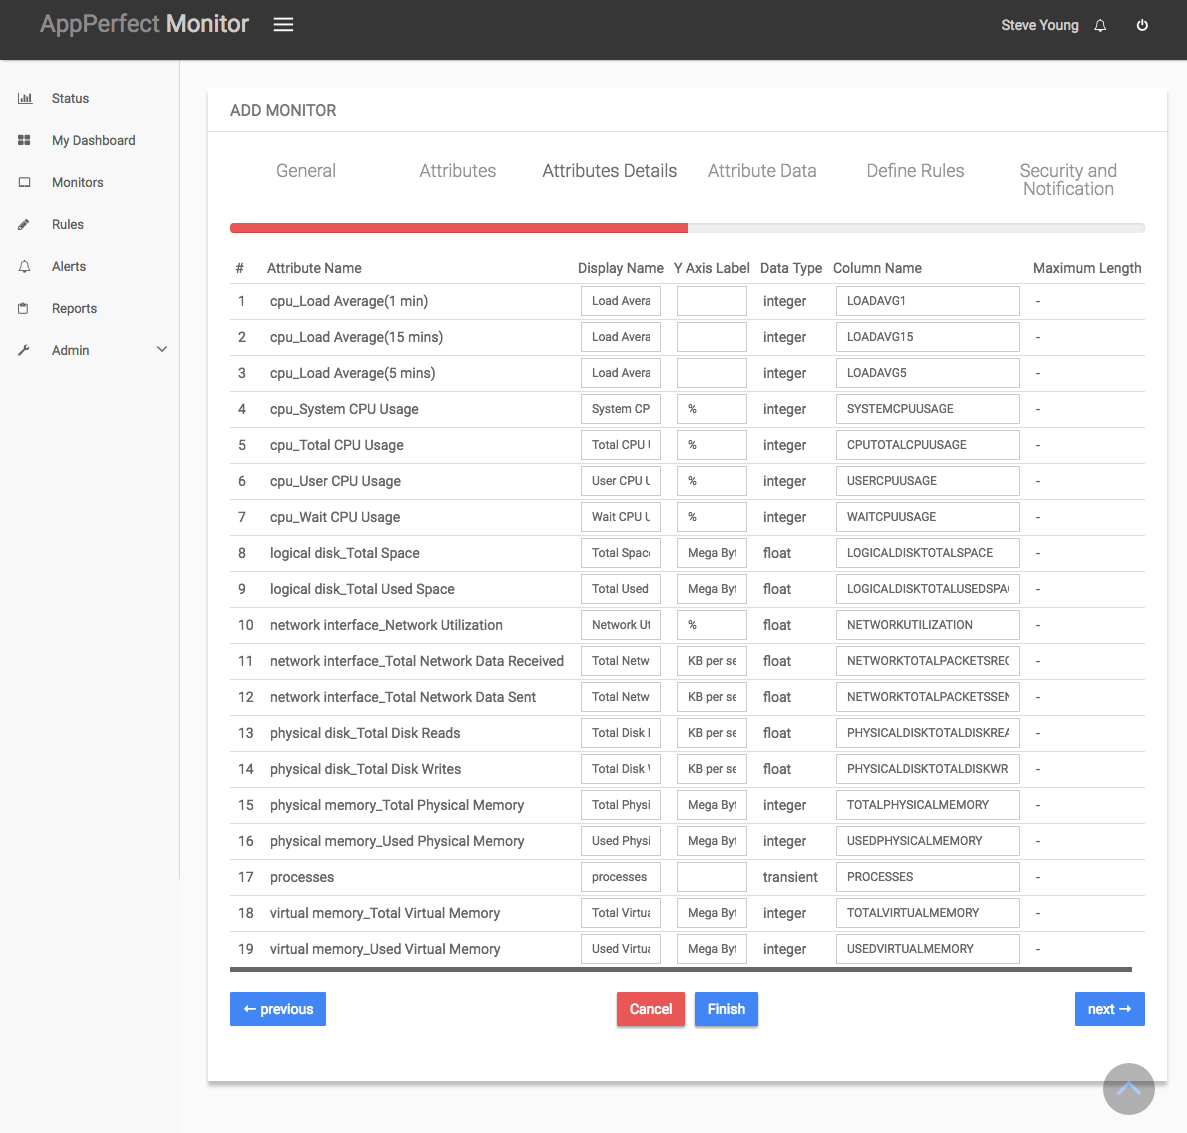
Next step shows the Attribute details of all the selected attributes in the previous step. You can customize the display labels for each of the attributes here.
-
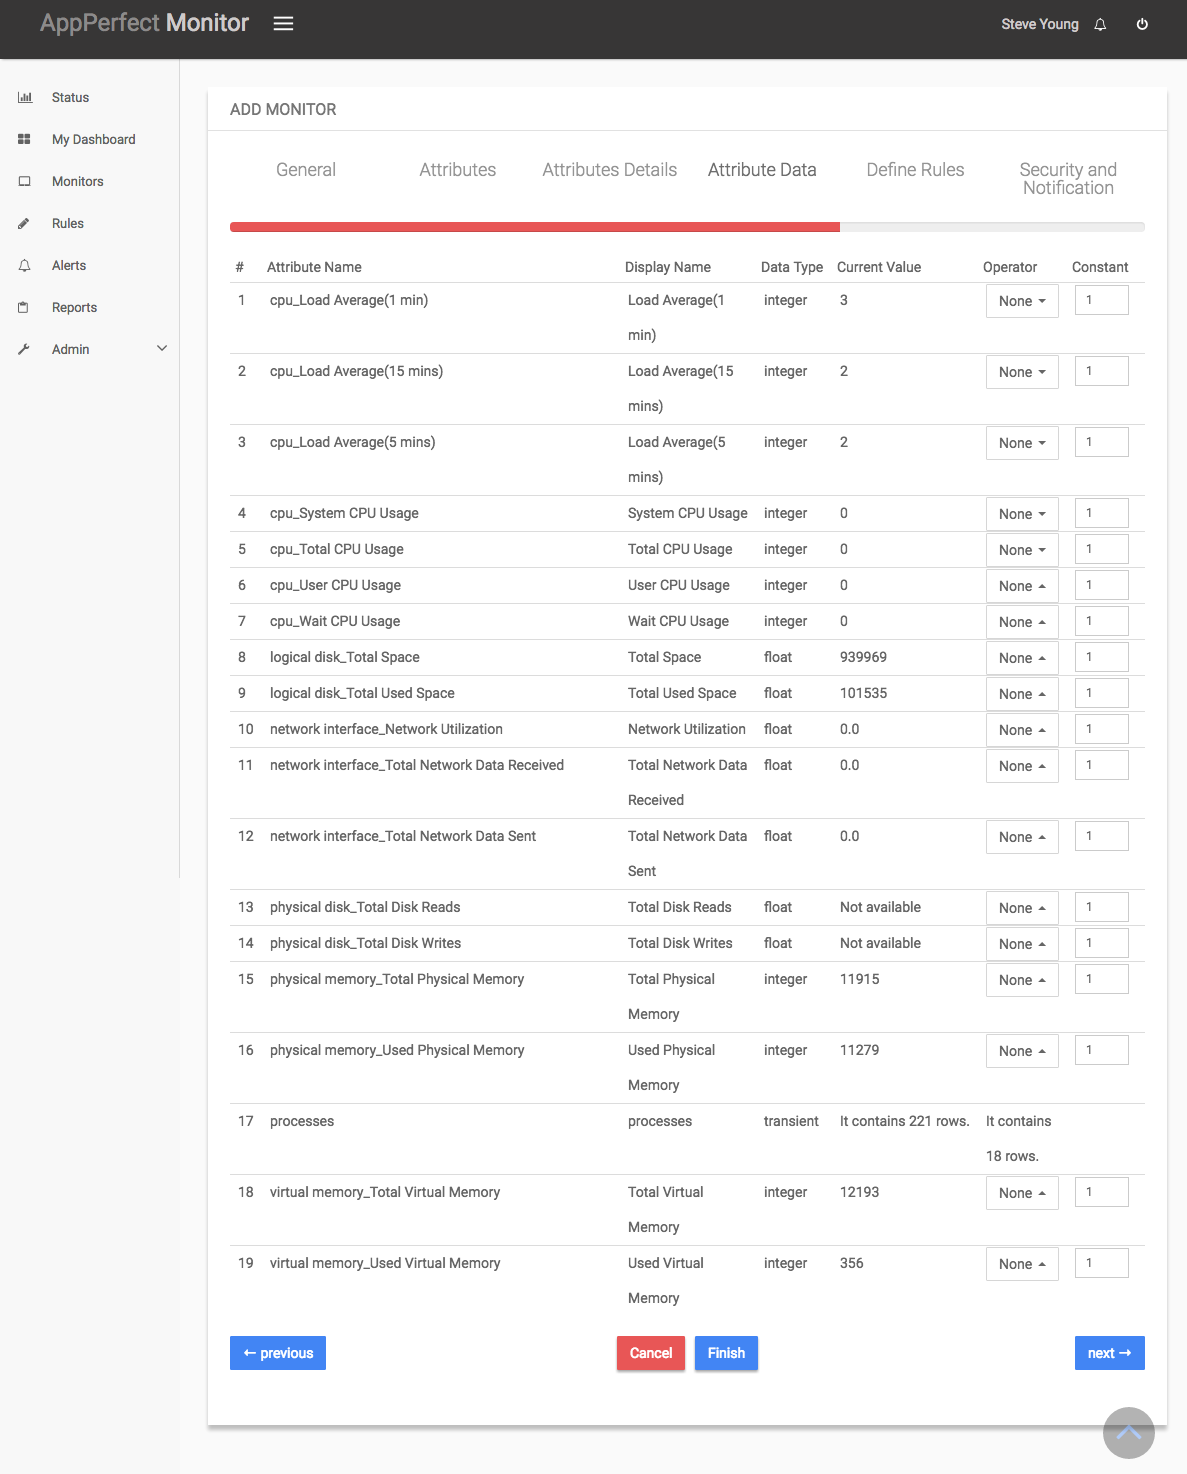
Next step shows the Attribute Data conversion where you can convert the attribute value to required unit. You can configure the operation which should be performed on the attribute value to create the final output value. For example by default the Available Physical Memory is in MegaBytes(MB). In case you need to convert the values to KiloBytes (KB), you can set an operator to convert the value from MB to KB. In this case it will be a Multiply operation by 1024.
-
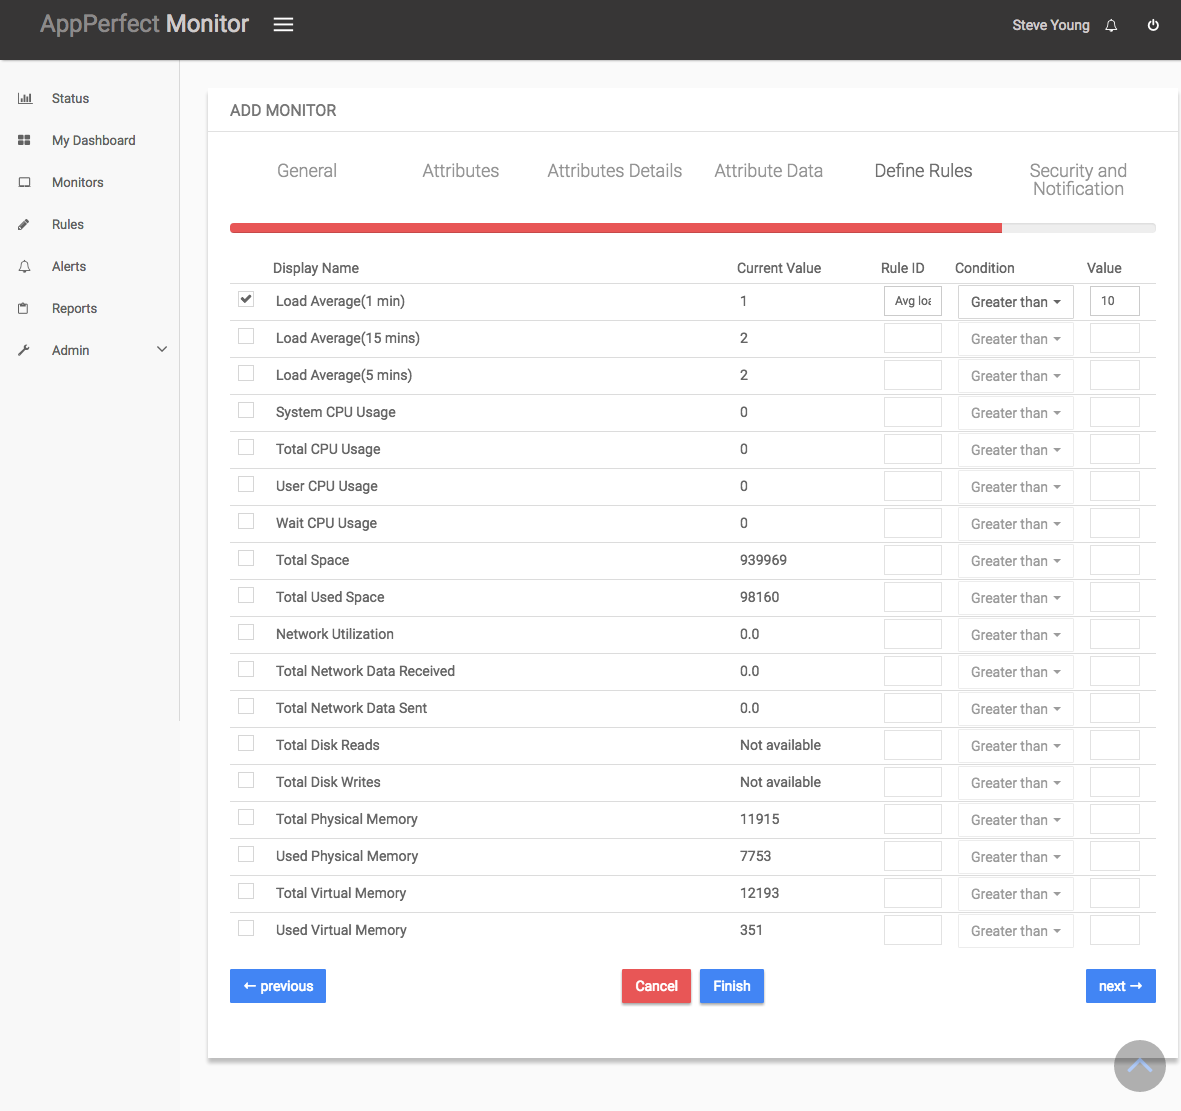
Next step shows the Defining Rules view. This view will provide a list of all numeric attributes. You can select the attributes for which you want to add a rule. A rule is defined as a conditional or threshold value which when exceeds, a notification would be sent. In a typical workflow the monitors extract data from the monitored device and send it to the rules engine. The rules engine evaluates the data to ensure no rule is violated and then sends it to the view manager. However, if a rule is violated, a message is immediately sent to the notification server to alert the user about the rule violation.Rules can be defined at a later stage as well. For details on how you can add/edit rules for the monitor, please see the Rules chapter.
- Next step shows the Security & Notification settings. When a rule is violated a notification is sent out to all the concerned users that a particular event has occurred and needs to be dealt with. This process is called notification. AppPerfect provides five modes of notification. They are Email notification, SMS notification, Custom notification, Log notification, Database notification, SNMP Trap notification. For details on each of the supported notification , please see the Notification chapter. In this view you can configure the type of notification which should be sent on Rule violation, Users/Groups to whom notification should be sent and also the subject and details on the notification message.
-
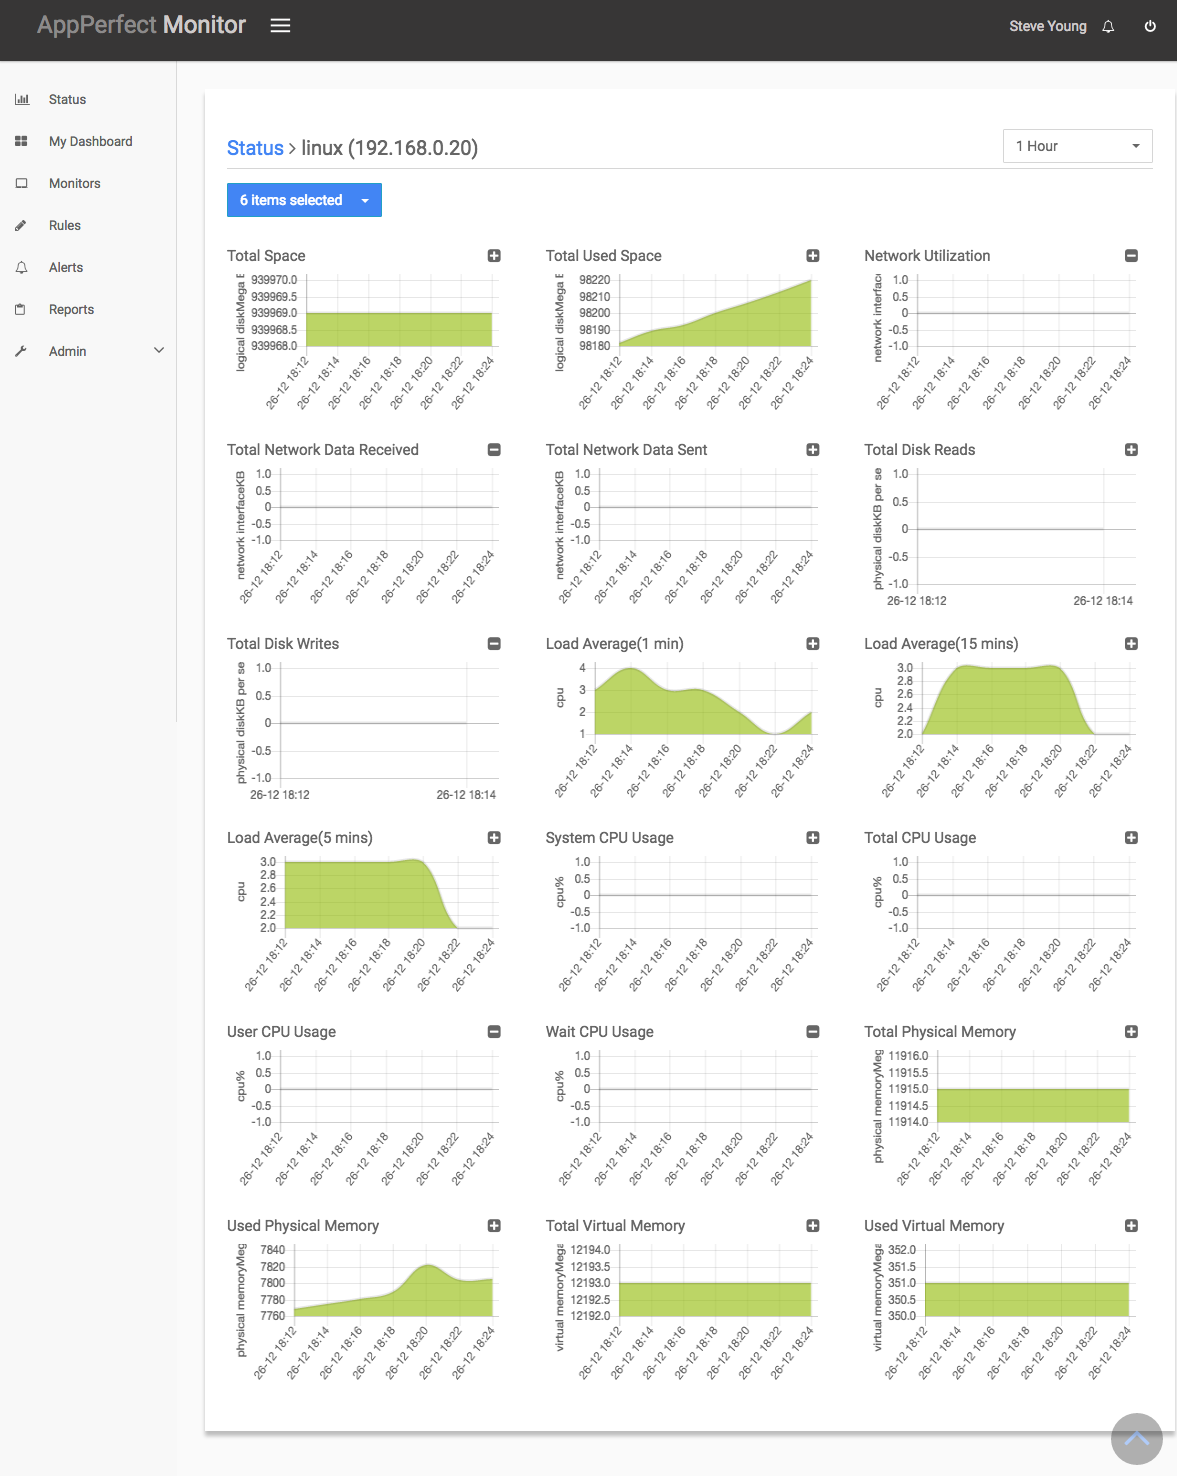
Click on finish button. We are done adding the monitor for Linux Server Monitoring. Now go to Status tab on left sidebar. Expand the data for IP provided in IP Address while creating the monitor. Expand the Linux monitor. Click on + icon against the charts that you want to monitor in your Dashboard and you can view the detailed results for each of the attributes being monitored for the target device.
Library z-lib Protect your crypto investments with ledger live desktop's robust security features. Trust in its encryption technology and secure storage solutions for peace of mind.
We use cookies for analytics, advertising and to improve our site.
By continuing to use our site, you accept to our Privacy policy
and allow us to store cookies.