Web Transaction Monitoring
Web Transaction Monitoring is a process to monitor the transactions in the AppPerfect Load Test. Web Transaction Monitoring helps ensuring that your Load Test script is running and the results are correct. Web Transaction Monitoring also monitors the response time which ensures that your test is running smoothly.
This tutorial provides a brief introduction on monitoring Web Transaction using AppPerfect Agentless Monitor. This tutorial assumes that you have successfully installed AgentlessMonitor and you have created test scripts for web load testing. For details on how to create test scripts for web transaction, refer to Creating Test Scripts for Web Load Testing.
Requirements for Web Transaction monitoring
Start AppService of LoadTest so that it can be accessed by Agentless Monitor.
To start AppService, Go to : AppPerfect_LoadTest_15.0.0 -> AppPerfect_LoadTest_Service and run the "start" script.
Configuring Agentless Monitor for Web Transaction monitoring
Following steps will explain how you can configure AppPerfect Agentless Monitor for Web Transaction Monitoring :
- Once you are logged into the Monitor Server you can see the Web-UI from which you can access all the features of the Monitor Server. Click the Monitors link from the top navigation bar. This will take you to Monitors tab. Click on Add button to Add a New Transaction Monitor.
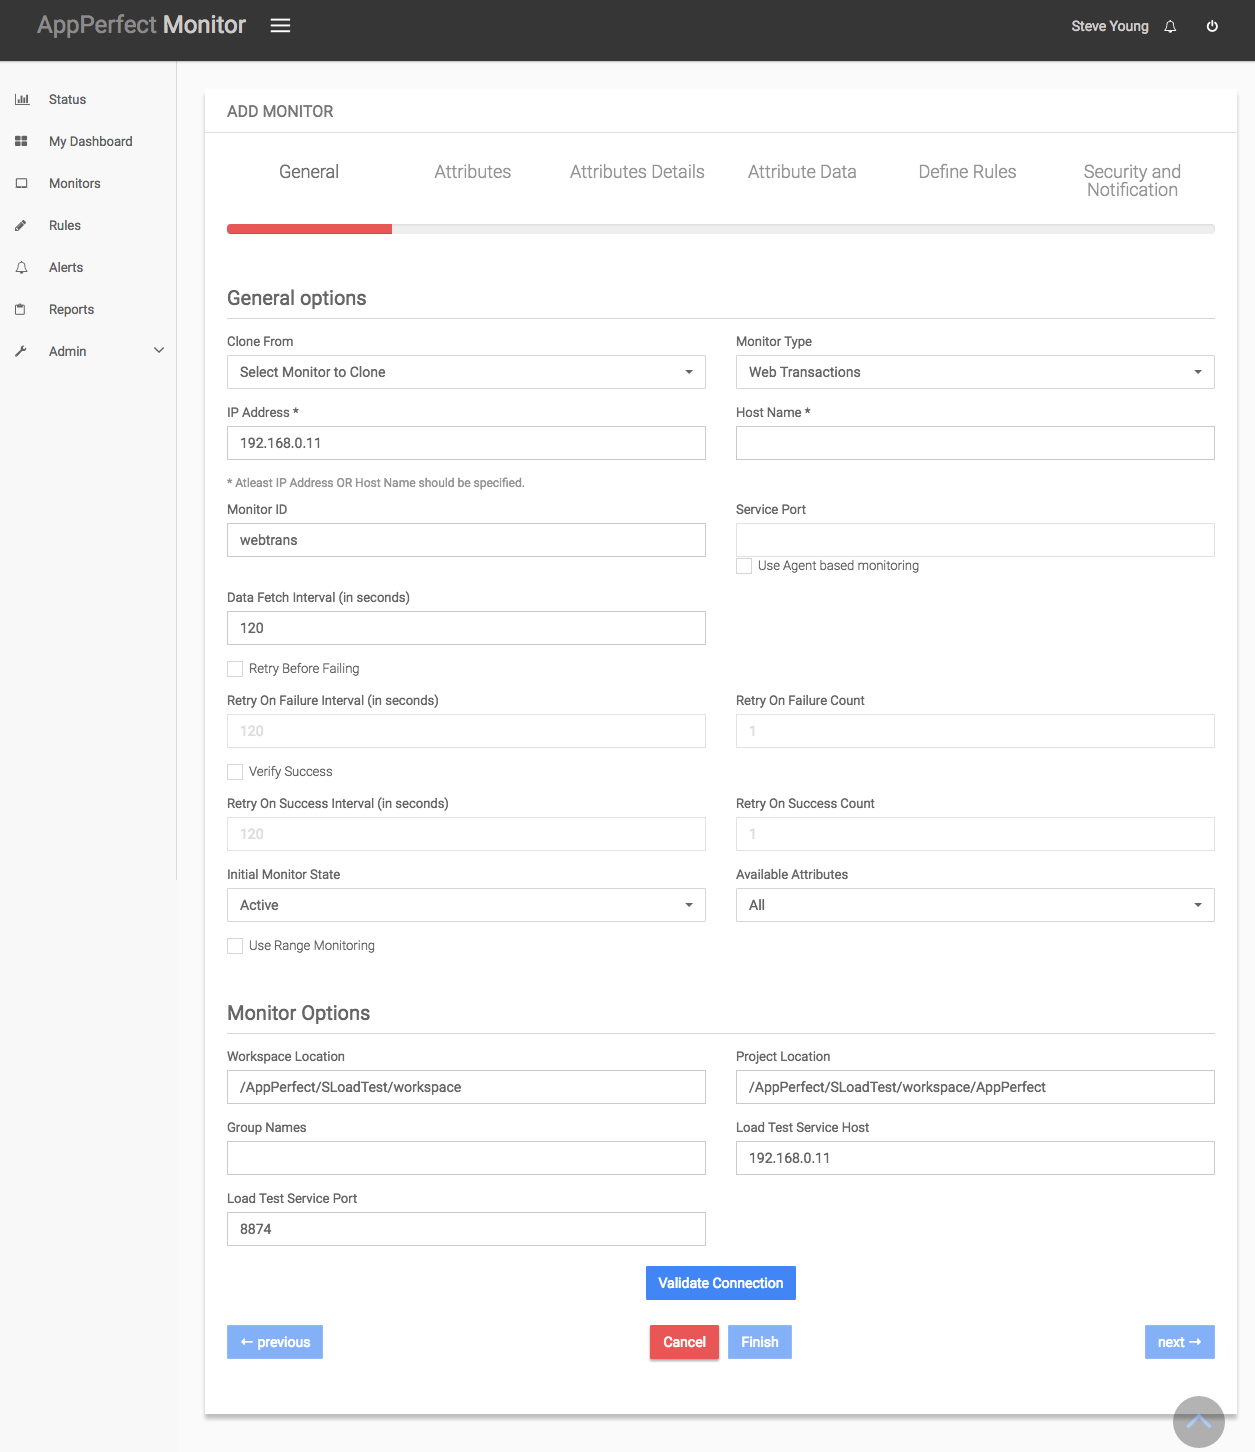
- Next Step is to define the Web Transaction Monitor. Provide the IP Address or Host Name of the machine where Load Testing is running.
- Select the Web Transaction Monitor from the Monitor type drop down. Specify a meaningful identifier for the monitor which will help identify the monitor in future.
- Specify the Data Fetch Interval which represents the time interval for which application should wait before fetching the monitoring data from the device. Monitoring Data will be fetched after every specified fetch interval. The smaller the time interval, the more granular the data. However, smaller time intervals also result in a much larger data set.
- You can specify if the monitor should be Active as soon as its added or should it be in suspended state.
- Next Option is to provide transaction specific configuration settings. Provide the workspace location ($LOADTEST_HOME/workspace) of your Load Test project, location on project($LOADTEST_HOME/workspace/project_name) and the group name under which the tasks to be monitored are added. Also specify the host name and service port on which the Load Test service is running. Once you are done providing the transaction specific settings, click on Validate Connection button to confirm that the Load Test Service is accessible.
- Next Step is to select the attributes to monitor. Web Transaction Monitoring allows you to monitor crucial parameters such as Response Time, Test Details, Test Duration, Test Status etc. Select the parameters you need to monitor from the list of attributes shown.
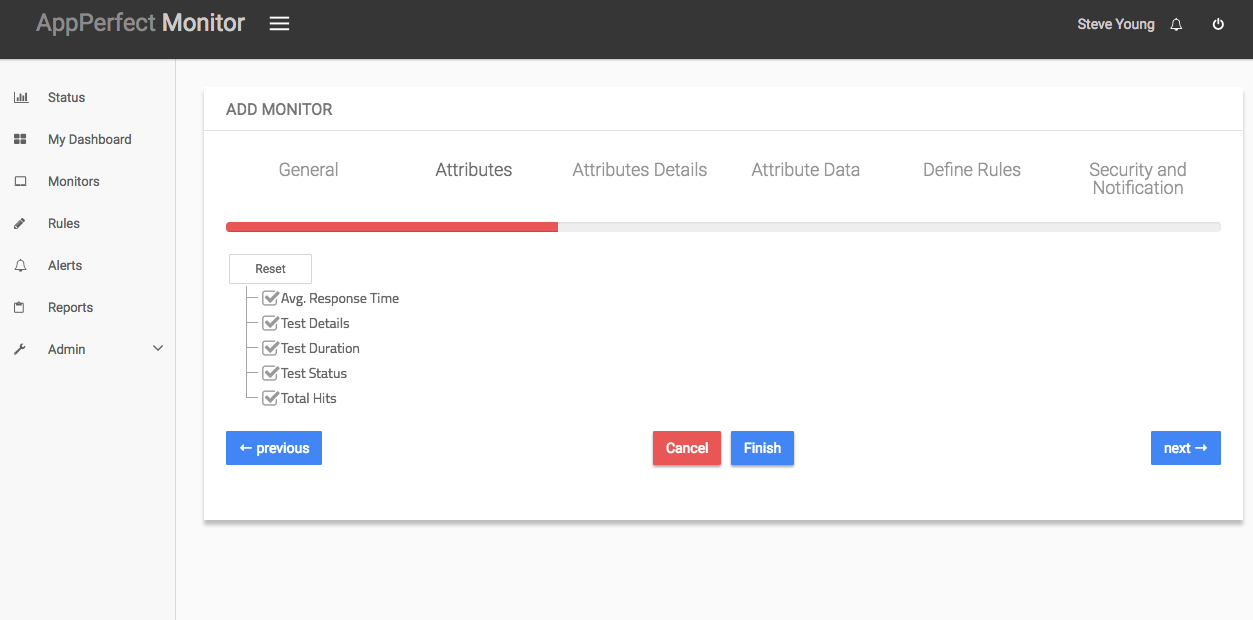
-
Next step shows the Attribute details of all the selected attributes in the previous step. You can customize the display labels for each of the attributes here.
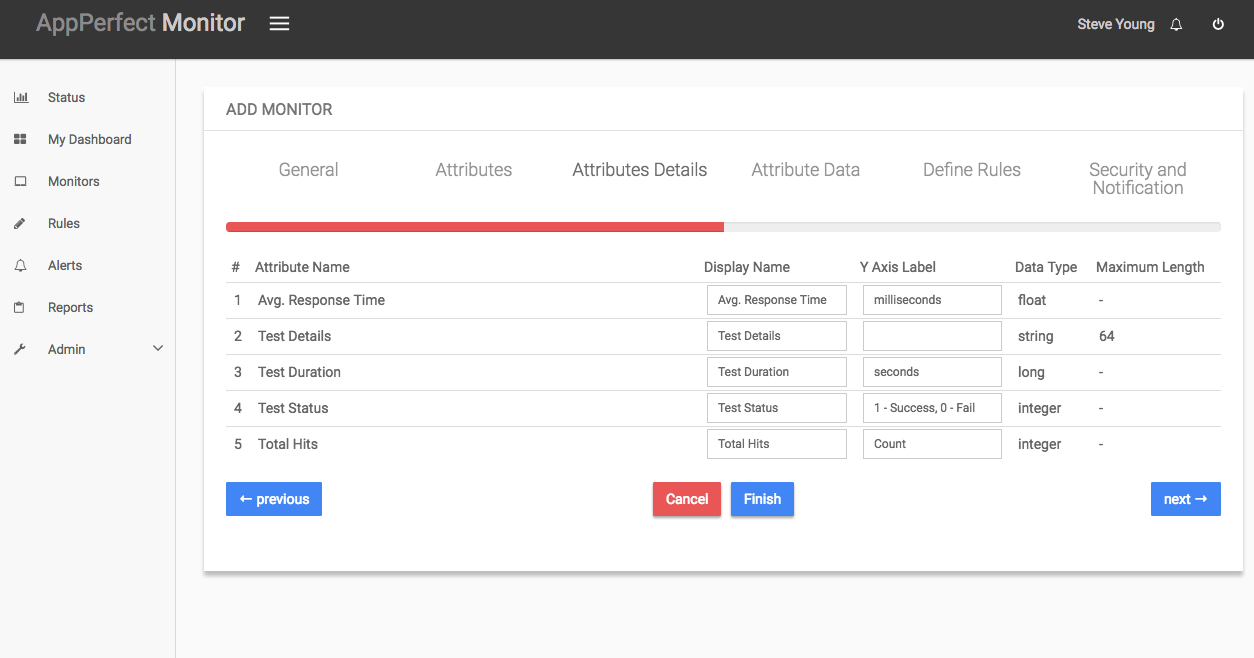
-
Next step shows the Attribute Data conversion where you can convert the attribute value to required unit. You can configure the operation which should be performed on the attribute value to create the final output value. For example by default the Response Time is in milli seconds. In case you need to convert the value to seconds, you can set an operator to convert the value from milli seconds to seconds. In this case it will be a Divide operation by 1000.
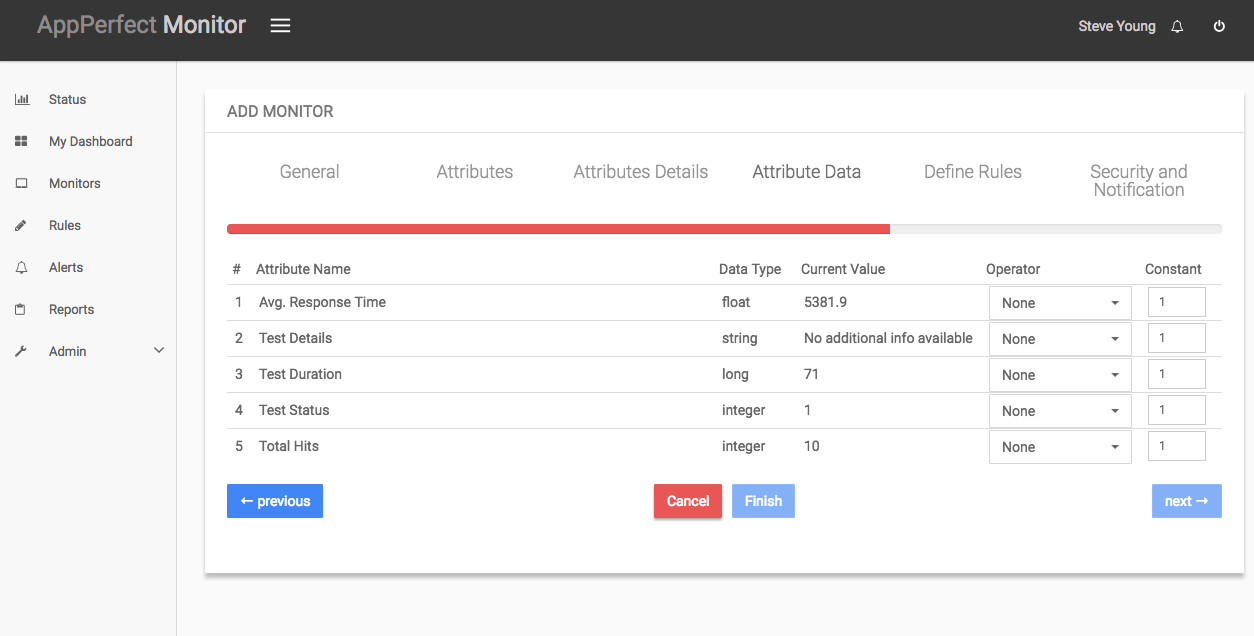
- Next step shows the Defining Rules view. This view will provide a list of all numeric attributes. You can select the attributes for which you want to add a rule. A rule is defined as a conditional or threshold value which when exceeds, a notification would be sent. In a typical workflow the monitors extract data from the monitored device and send it to the rules engine. The rules engine evaluates the data to ensure no rule is violated and then sends it to the view manager. However, if a rule is violated, a message is immediately sent to the notification server to alert the user about the rule violation.Rules can be defined at a later stage as well. For details on how you can add/edit rules for the monitor, please see the Rules chapter.
- Next step shows the Security & Notification settings. When a rule is violated a notification is sent out to all the concerned users that a particular event has occurred and needs to be dealt with. This process is called notification. AppPerfect provides five modes of notification. They are Email notification, SMS notification, Custom notification, Log notification, Database notification, SNMP Trap notification. For details on each of the supported notification , please see the Notification chapter. In this view you can configure the type of notification which should be sent on Rule violation, Users/Groups to whom notification should be sent and also the subject and details on the notification message.
- Click on finish button. We are done adding the monitor for Web Transaction Monitoring. Once Web Transaction Monitor is added, you will get a message Web Transaction Monitor added successfully. Now go to Status. Expand the data for IP provided in IP Address while creating the monitor. Expand Web Transaction Monitor. Click on + icon against the charts that you want to monitor in your Dashboard.