Web Server Monitoring
Web servers have been a common utility that most business users utilize for everyday work. On a larger scale, Web servers such as Apache HTTP and Microsoft IIS provide the front end to a lot of multi-tier applications. Web Server monitoring is a process to monitor performance and state of the server. Web Server Monitoring helps monitoring critical performance metrics of web server. Web Server Monitoring includes monitoring hits, requests, bytes transferred and CPU time consumed by Web Server to serve the requests.
Agentless Web Server Monitoring with AppPerfect
AppPerfect offers Web Server Monitoring solution in the form of AppPerfect Agentless Monitor. Whether you are using a Web server for a simple intranet application that serves static content, or you are using a Web server as a front end to a clustered, multi-tier Internet infrastructure, AppPerfect Agentless Monitor can monitor your Web server for you. AppPerfect's Web Server Monitoring is the ideal solution to monitor your web server's resources. AppPerfect's Web Server Monitoring is found to be most efficient, reliable and accurate solution by its customers. Regular agents impose a substantial overhead on your server resources in terms of CPU and memory. By contrast, AppPerfect's Web Server Monitoring solution implements Agentless Architecture and uses existing web server's modules to extract server performance and state metrics information. Web Server Monitoring with AppPerfect is extremely lightweight and adds negligible overhead to target web server while monitoring.
Configuring Agentless Monitor for Apache Web Server Monitoring
Following steps will explain how you can configure AppPerfect Agentless Monitor for Web Server Monitoring :
- Once you are logged into the Monitor Server you can see the Web-UI from which you can access all the features of the Monitor Server. Click the Monitors link from the top navigation bar. This will take you to Monitors tab. Click on Add button to Add a New Web Server Monitor.
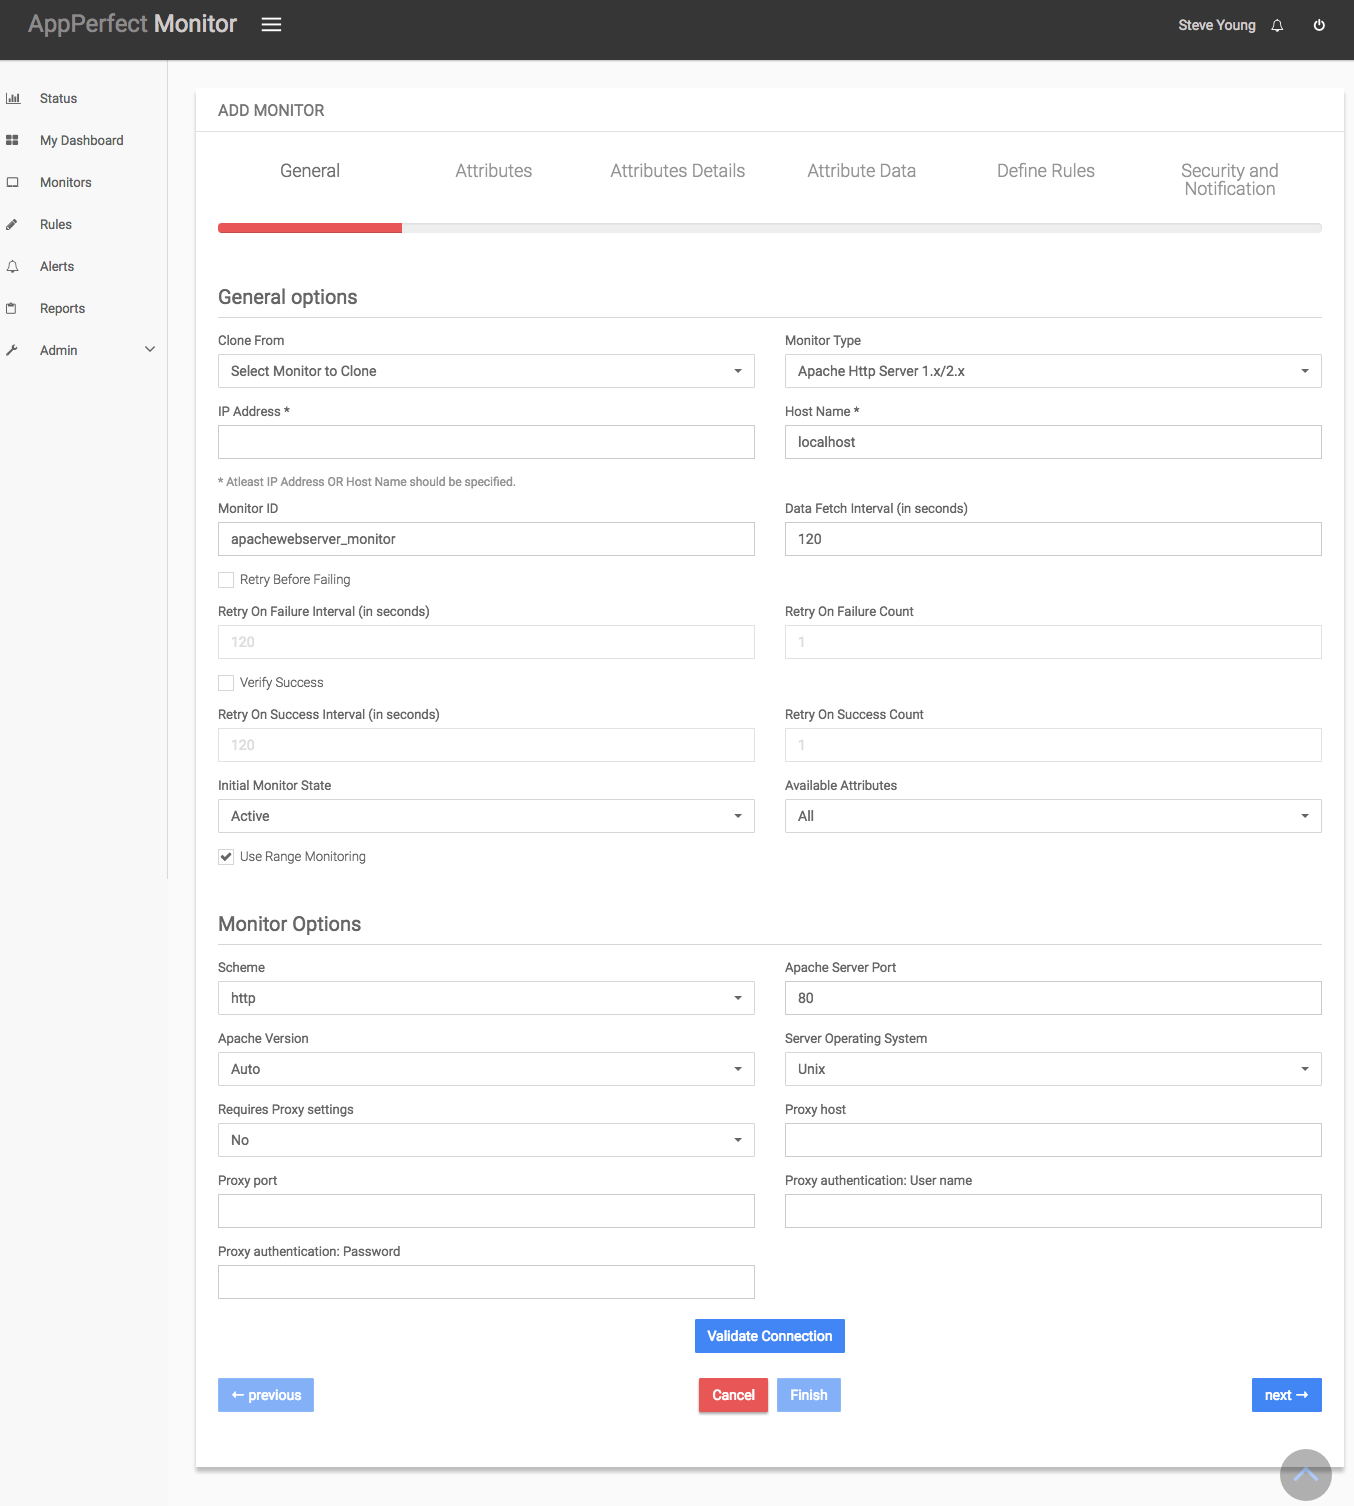
- Next Step is to define the Web Server Monitor. Provide the IP Address or Host Name of the target web server which needs to be monitored.
- Select the Web Servers Monitor Type from the drop down. AppPerfect supports monitoring for Apache 1.x/2.x and Microsoft IIS 5.x. Select the monitor type which suits your requirement. AppPerfect can monitor critical performance metrics of Apache HTTP server and Microsoft IIS server. Before you can monitor Apache / IIS, you need to configure them for monitoring. To configure Web Server for monitoring refer to Web Server Monitor chapter,
- Specify a meaningful identifier for the monitor which will help identify the monitor in future.
- Specify the Data Fetch Interval which represents the time interval for which application should wait before fetching the monitoring data from the device. Monitoring Data will be fetched after every specified fetch interval. The smaller the time interval, the more granular the data. However, smaller time intervals also result in a much larger data set.
- You can specify if the monitor should be Active as soon as its added or should it be in suspended state. You can also specify if all the attributes should be monitored or only some predefined attributes should be monitored.
- Next Option is to provide web server specific settings, like server port, version, operation system, credentials etc.. Finally click on Validate Connection button to confirm that monitored device is accessible.
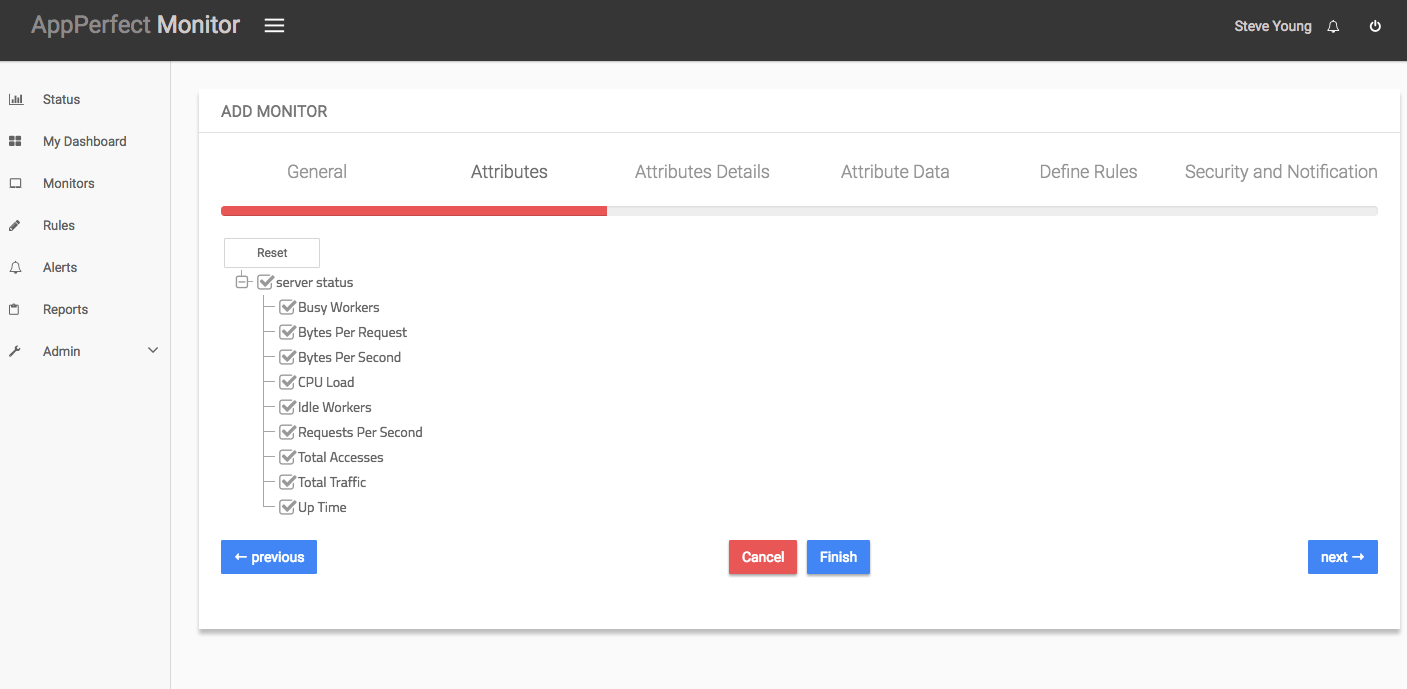
- Next Step is to Select the Attributes to monitor. Web Server Monitoring allows you to monitor crucial parameters such as Requests processed per second, Bytes per Request, Bytes sent/received per second, total accesses, traffic, up time etc. Select the parameters you need to monitor from the list of attributes shown. For details on supported attributes refer to Web Server Monitor chapter.
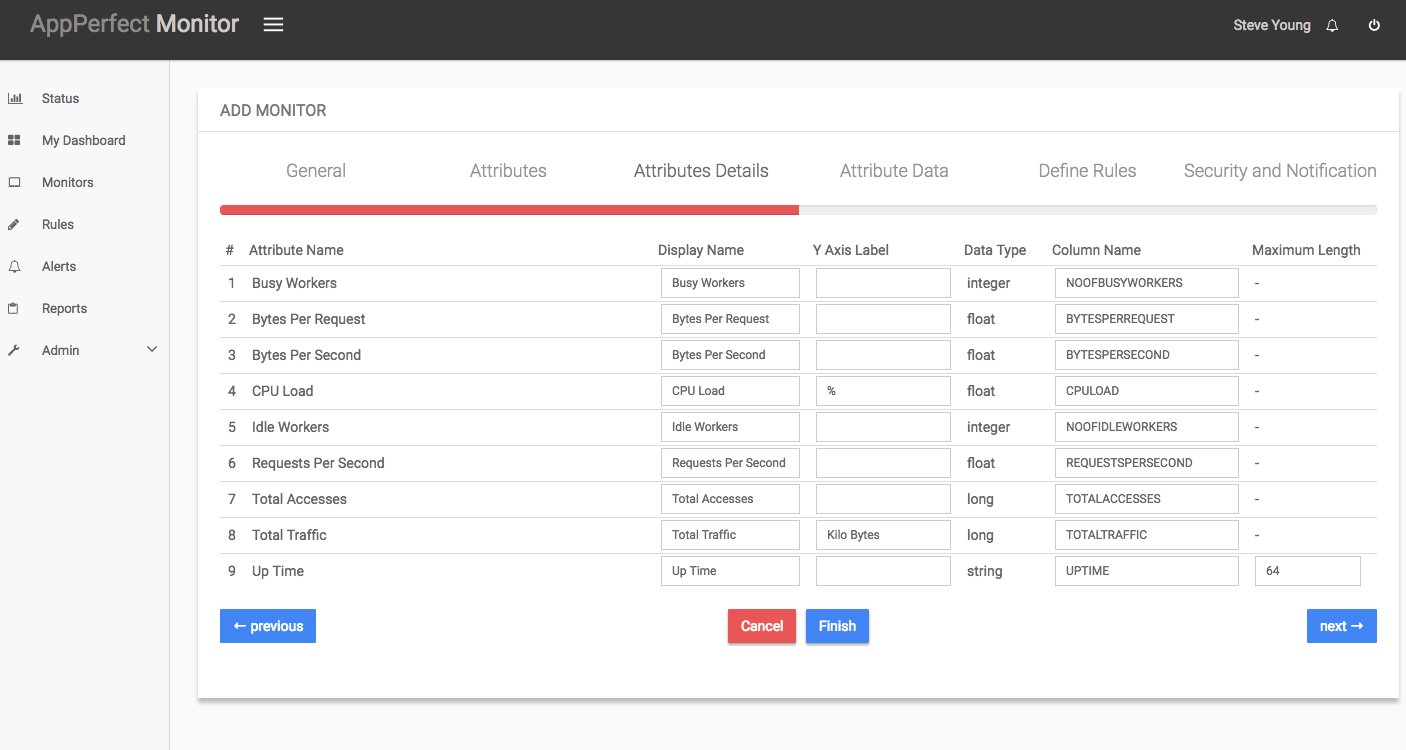
- Next step shows the Attribute details of all the selected attributes in the previous step. You can customize the display labels for each of the attributes here, like changing kilobytes to bytes for Total Traffic.
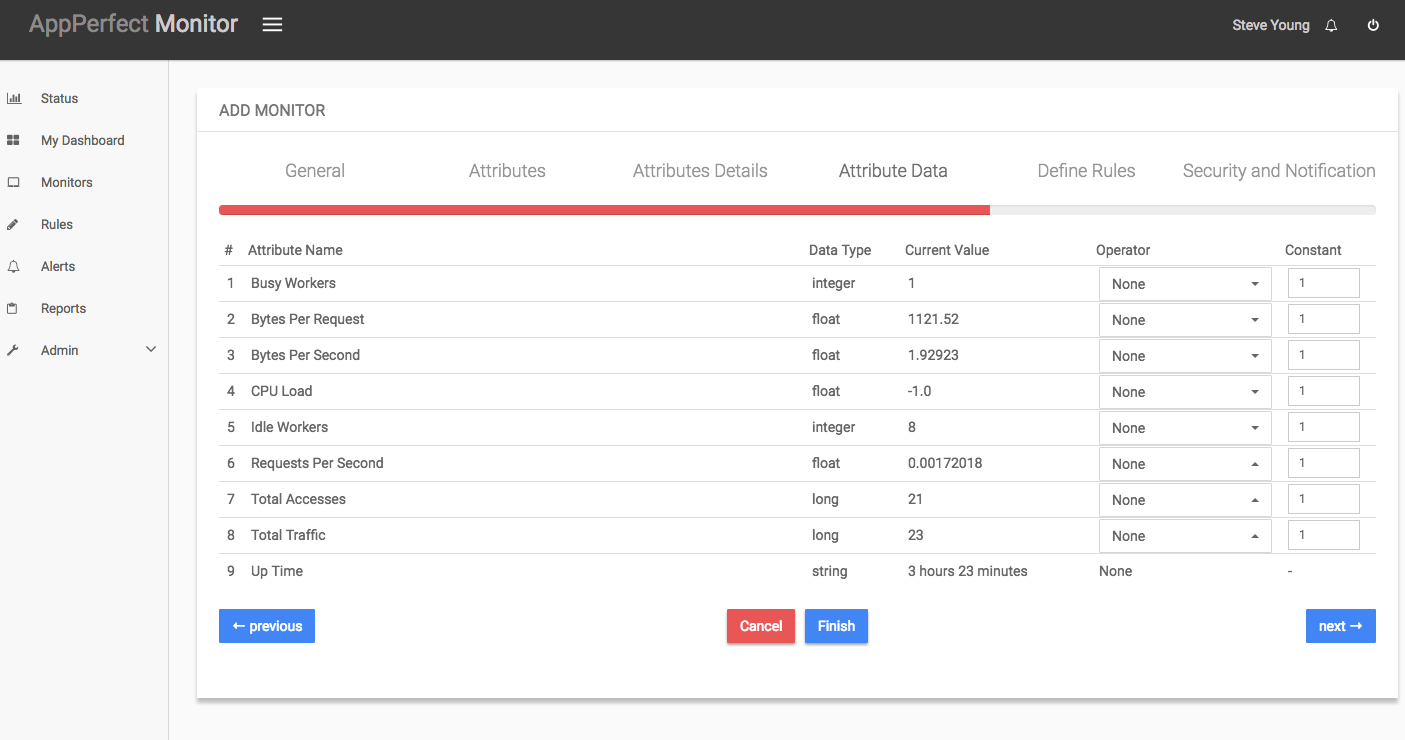
- Next step shows the Attribute Data conversion where you can convert the attribute value to required unit. You can configure the operation which should be performed on the attribute value to create the final output value. For example by default the Total traffic is in KiloBytes(KB). In case you need to convert the values to Bytes, you can set an operator to convert the value from KB to bytes. In this case it will be a Multiply operation by 1024.
- Next step shows the Defining Rules view. This view will provide a list of all numeric attributes. You can select the attributes for which you want to add a rule. A rule is defined as a conditional or threshold value which when exceeds, a notification would be sent. In a typical workflow the monitors extract data from the monitored device and send it to the rules engine. The rules engine evaluates the data to ensure no rule is violated and then sends it to the view manager. However, if a rule is violated, a message is immediately sent to the notification server to alert the user about the rule violation.Rules can be defined at a later stage as well. For details on how you can add/edit rules for the monitor, please see the Rules chapter.
- Next step shows the Security & Notification settings. When a rule is violated a notification is sent out to all the concerned users that a particular event has occurred and needs to be dealt with. This process is called notification. AppPerfect provides five modes of notification. They are Email notification, SMS notification, Custom notification, Log notification, Web Server notification, SNMP Trap notification. For details on each of the supported notification , please see the Notification chapter. In this view you can configure the type of notification which should be sent on Rule violation, Users/Groups to whom notification should be sent and also the subject and details on the notification message.
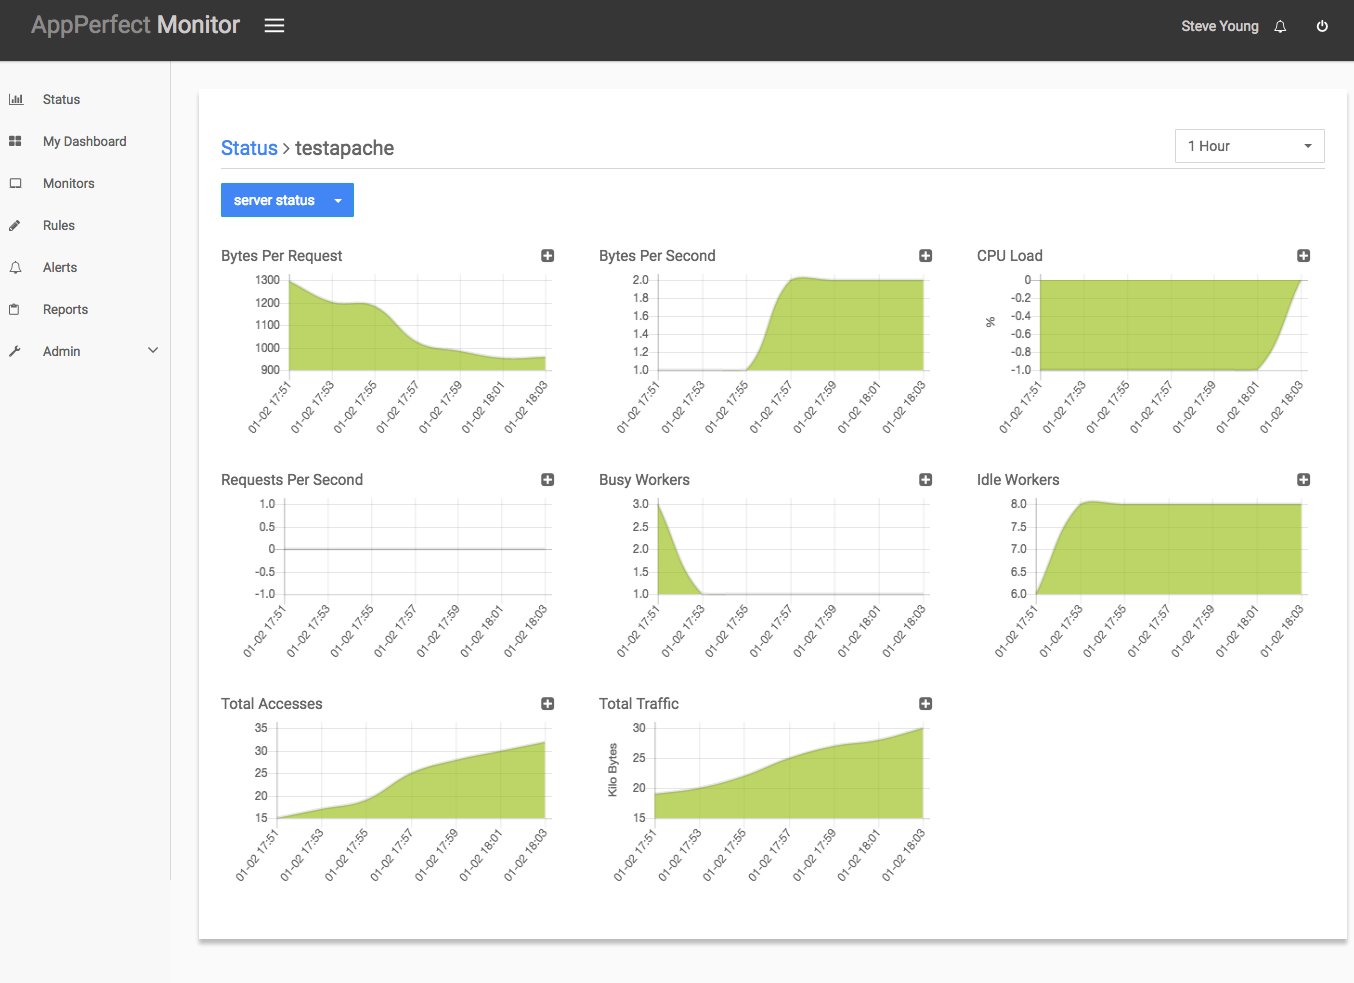
- Click on finish button. We are done adding the monitor for Web Server Monitoring. Once Apache server Monitor is added, you will get a message Database Monitor added successfully. Now go to Status. Expand the data for IP provided in IP Address while creating the monitor. Expand MongoDB Monitor. Click on + icon against the charts that you want to monitor in your Dashboard.
Conclusion :
Web Server Monitoring helps monitoring critical performance metrics of web server. Web Server Monitoring includes monitoring hits, requests, bytes transferred and CPU time consumed by Web Server to serve the requests. AppPerfect's Web Server Monitoring solution is platform independent. You can monitor Apache HTTP Server and Microsoft IIS server. AppPerfect Agentless Monitor is found to be most efficient, reliable and accurate monitoring solution by its customers. In case you have not yet tried AppPerfect Agentless Monitor, Download Now and give it a try today.