Website Monitoring / URL Monitoring
Website Monitoring or URL Monitoring is a process to monitor website or URLs for its availability as well as performance. Website Monitoring or URL Monitoring helps ensuring that your website or URL is available and is running 24/7. Website monitoring or URL Monitoring also monitors response time for your website or URL which ensures that your web application is performing well. Website Monitoring or URL Monitoring also provides way to validate the response ensuring that your website is showing valid contents.
Website Monitoring / URL Monitoring with AppPerfect
AppPerfect offers Website or URL Monitoring solution in the form of AppPerfect Agentless Monitor. AppPerfect's Website or URL Monitoring is the ideal solution to monitor your website for both availability and performance. AppPerfect's Website Monitoring is found to be most affordable, cost effective, efficient, reliable and accurate solution by its customers. Regular agents impose a substantial overhead on your server resources in terms of CPU and memory. By contrast, AppPerfect's Website Monitoring solution implements agentless architecture and provide way to monitor website remotely without need to install any component on target device. Website Monitoring with AppPerfect is extremely lightweight and adds negligible overhead to target system while monitoring.
Following steps will explain how you can configure AppPerfect for Website or URL Monitoring :
- Once you are logged into the Monitor Server you can see the Web-UI from which you can access all the features of the Monitor Server. Click the Monitors link from the top navigation bar. This will take you to Monitors tab. Click on Add button to Add a New Website or URL Monitor.
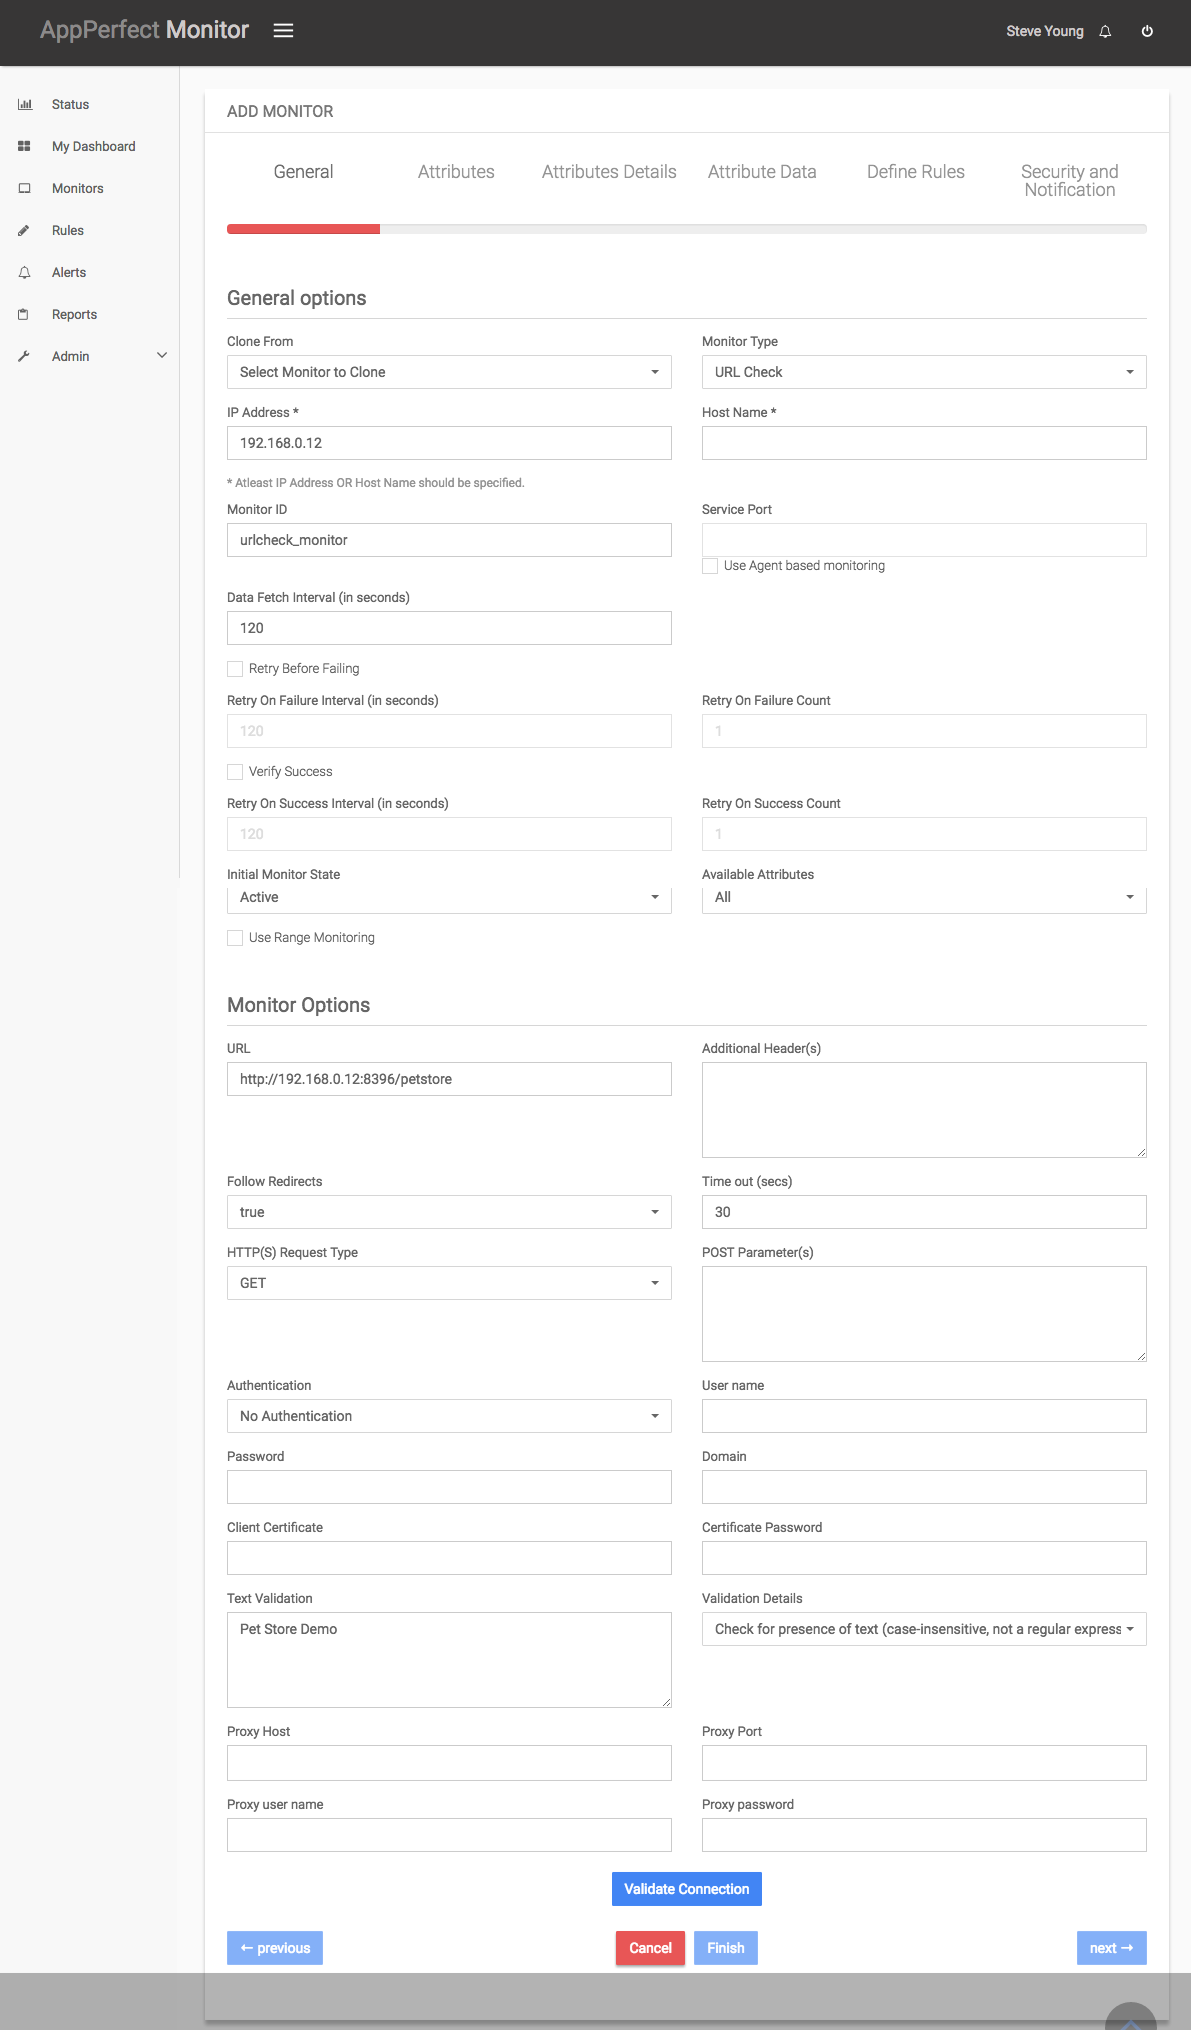
- Next Step is to define the URL Monitor. Provide the IP Address or Host Name of the machine where website is hosted.
- Select the URL Check monitor from the Monitor type drop down. Specify a meaningful identifier for the monitor which will help identify the monitor in future.
- Specify the Data Fetch Interval which represents the time interval for which application should wait before executing the URL. URL will be executed and monitoring data will be fetched after every specified fetch interval. The smaller the time interval, the more granular the data. However, smaller time intervals also result in a much larger data set.
- You can also specify if monitor should retry execution in case of failure and also the time interval it should wait for before retrying.
- You can specify if the monitor should be Active as soon as its added or should it be in suspended state.
- Next Option is to provide URL which should be monitored. Specify whether HTTP redirects (requests with response code 3xx) should be automatically followed by this connection.
- Specify the time out value in seconds. It is used when opening a communications link to this URL. If the timeout expires before the connection can be established, monitor goes into polling state. A timeout of zero is interpreted as an infinite timeout.
- Specify the Request Type. Request type could be either GET / POST. If the request type is POST, provide post parameters which should be passed as part of the POST request. If there are multiple parameters, seperate them using an &. Example: name1=value1&name2=value2&name3=value3
- In case your web application requires authentication(Basic/NTLM/Digest) then select the same from Authentication drop down. Also provide the Authentication credentials if applicable.
- If your web application requires two-way SSL authentication, then copy the client certificate in AM_INSTALL_HOME/tomcat/webapps/monitor/clientcerts folder and provide just the file name of the certificate in the UI. Also provide certificate password if applicable.
- You can specify the text in Text Validation box that should be validated in the response after firing the URL. Text will be searched in the response received after firing the URL. If not found monitor will go into polling state. You can perform either case-sensitive or case-insensitive search. You can also specify regular expression as search string.
- In case you require Proxy to access web application then provide the proxy server settings. You can specify the proxy host, port and credentials if required.
- Once you are done providing all the settings, click on Validate Connection button to confirm that URL is accessible.
- Next Step is to select the attributes to monitor. Website Monitoring allows you to monitor crucial parameters such as Response Code, Response phrase, Response Time and Response Validation. Select the parameters you need to monitor from the list of attributes shown. For details on supported attributes refer to URL Check Monitor chapter.
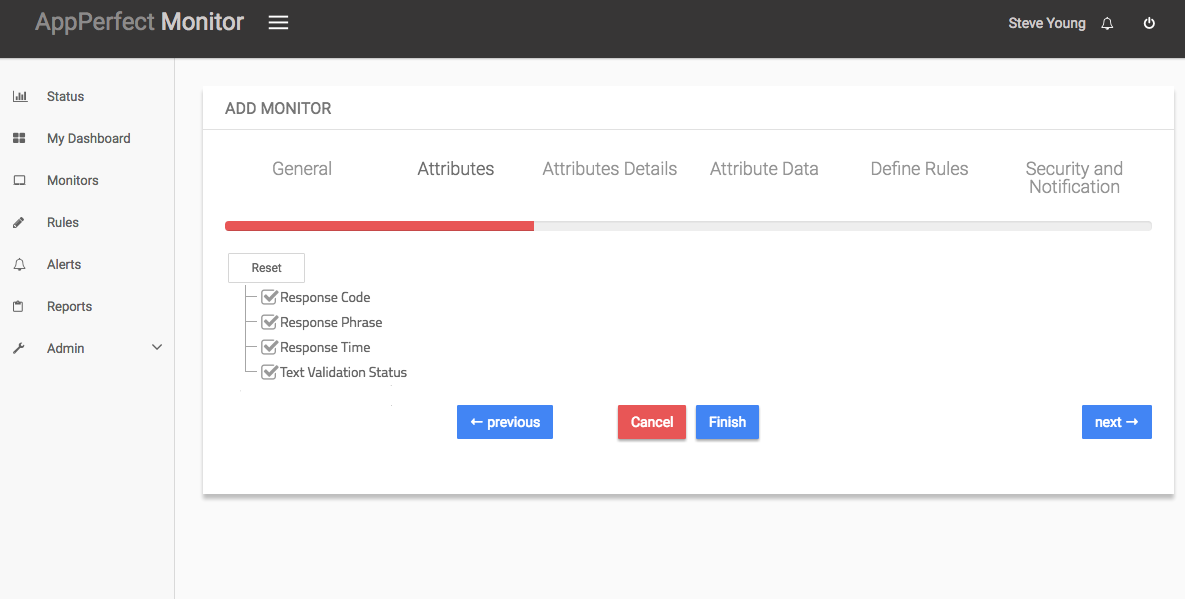
-
Next step shows the Attribute details of all the selected attributes in the previous step. You can customize the display labels for each of the attributes here.
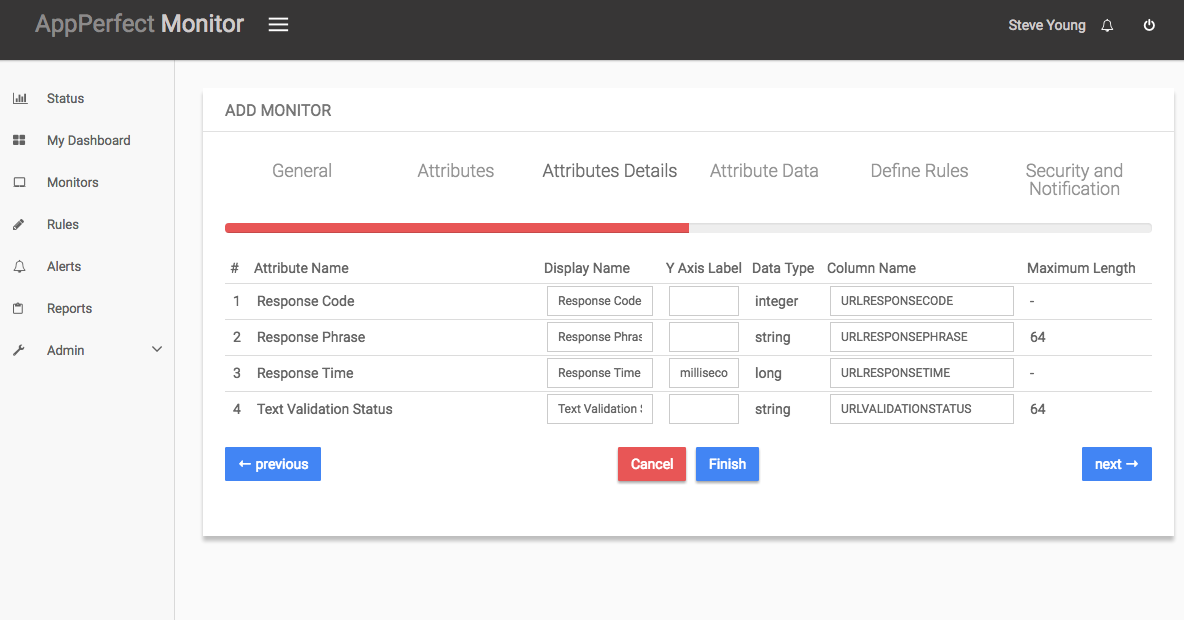
-
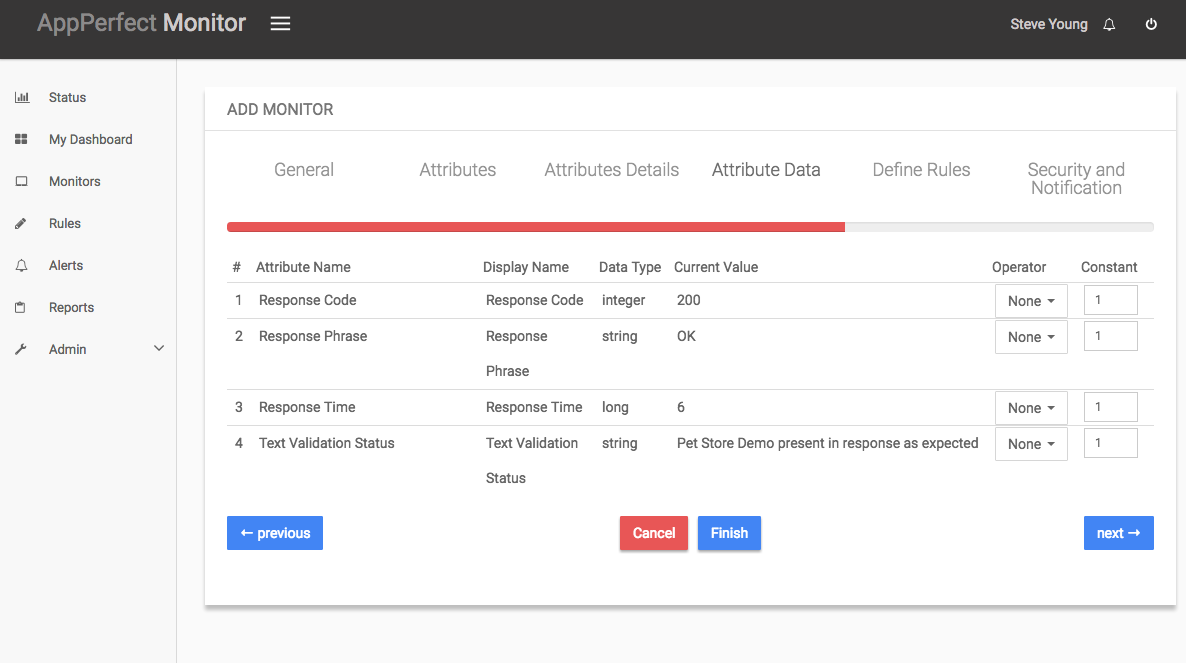
Next step shows the Attribute Data conversion where you can convert the attribute value to required unit. You can configure the operation which should be performed on the attribute value to create the final output value. For example by default the Response Time is in milli seconds. In case you need to convert the value to seconds, you can set an operator to convert the value from milli seconds to seconds. In this case it will be a Divide operation by 1000.
- Next step shows the Defining Rules view. This view will provide a list of all numeric attributes. You can select the attributes for which you want to add a rule. A rule is defined as a conditional or threshold value which when exceeds, a notification would be sent. In a typical workflow the monitors extract data from the monitored device and send it to the rules engine. The rules engine evaluates the data to ensure no rule is violated and then sends it to the view manager. However, if a rule is violated, a message is immediately sent to the notification server to alert the user about the rule violation.Rules can be defined at a later stage as well. For details on how you can add/edit rules for the monitor, please see the Rules chapter.
- Next step shows the Security & Notification settings. When a rule is violated a notification is sent out to all the concerned users that a particular event has occurred and needs to be dealt with. This process is called notification. AppPerfect provides five modes of notification. They are Email notification, SMS notification, Custom notification, Log notification, Database notification, SNMP Trap notification. For details on each of the supported notification , please see the Notification chapter. In this view you can configure the type of notification which should be sent on Rule violation, Users/Groups to whom notification should be sent and also the subject and details on the notification message.
- Click on finish button. We are done adding the monitor for Website Monitoring. You will find the newly added monitor on left hand side Monitor tree. Select the Monitor and on right hand side you can view the detailed results for each of the attributes being monitored for the target device.
Conclusion :
Website Monitoring or URL Monitoring helps you monitor website or URLs for its availability as well as performance. Website Monitoring or URL Monitoring also provides way to validate the response ensuring that your website is showing valid contents. AppPerfect's Website Monitoring solution is platform independent. AppPerfect Agentless Monitor is found to be most affordable, cost effective, efficient, reliable and accurate Monitoring solution by its customers. In case you have not yet tried AppPerfect Agentless Monitor, Download Now and give it a try today.